Numbers in this note are for the Melbourne region as a whole. They are compiled from various sources. Please see the urban water notes for each of the below organisations for data sources and further information.
Data source organisations referred to below are:
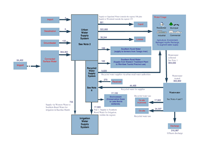
Figure 1. Urban note – summary of the Melbourne region*
*All volumes are in megalitres (ML)
The differences between urban water distribution system components are attributed to unaccounted water losses, and limitations in the calculations of volumes sourced, treated and supplied for consumption and other uses.
Note 1: Direct comparison of the total volume of water supplied (via the urban water supply system and the recycled water supply system) and the total volume of wastewater generated in a region is not feasible due to data limitations on:
Note 2: Total volume of water sourced for the urban water supply system (IN): 364,414 ML
Total supplied by the urban water supply system (OUT) = 362,468 ML. Total volume of water usage via urban water supply system (322,660 ML); losses (38,244 ML), exports out of the region (681 ML), supply to Southern Rural Water for irrigation in Bacchus Marsh (733 ML) and (5 ML); volume taken from Tarago River for Southern Rural Water supply to farmers (150 ML)
IN – OUT difference (1,946 ML) is likely to be due to unaccounted losses and limitations in the calculations of volumes sourced, received and supplied by water authorities.
Note 3: Water usage components A plus B (332,488 ML):
Note 4: (C) Wastewater treated (303,989 ML); (D) Effluent discharge (216,997 ML) + recycled water produced (86,639 ML) = 303,636 ML
This difference between (C) and (D) is likely to be due to the differences in metering accuracies and unaccounted losses.
Note 5: Total recycled water produced (86,639 ML) = recycled water for supplies (44,400 ML) + total volume of recycled water used on-site (42,239 ML).
Total volume of recycled water used on-site (42,239 ML) = volume used on-site within process (17,902 ML) + volume used on-site (24,337 ML).
Note 6: Recycled water supplies
IN = recycled water volume for supplies (44,400 ML) + recycled water received from other organisations in the region (270 ML) = 44,670 ML.
OUT = recycled water supplied via urban retail water authorities (9,828 ML) + recycled water supplied from Melbourne Water to Southern Rural Water for (a) irrigation (17,563 ML) plus (b) Werribee tourist precinct use (102 ML) + Melbourne Water (conservation flows) to environment (17,199 ML) = 44,692 ML.
IN – OUT = –22 ML, which is attributed to differences in metering accuracies and locations relevant to recycled water supplied and received by different organisations and water authorities.
Note 7: Recycled water received from other organisations in the region (270 ML) represents the recycled water purchased from TopAq Eastern Irrigation Scheme (EIS) and Inkerman Greywater Treatment Plant.
| Sources of water | Volume (ML) | Note | |
|---|---|---|---|
| Delivered via the water supply system (connected areas) | Water sourced from external entity |
0 |
|
| Water sourced from surface water |
364,282 |
MW_U1+ WW_U1 | |
| Water sourced from groundwater |
132 |
SEW_U2 + WW_U2 | |
| Water sourced from desalination |
0 |
||
| Water sourced from recycle |
(see Table 4) |
||
| Total water sourced to supply |
364,414 |
||
| Directly abstracted water * | Water sourced from surface water |
NA |
|
| Water sourced from groundwater |
NA |
||
| Water sourced from farm dam |
NA |
||
| Water sourced from rainwater tank |
NA |
||
| Total water directly sourced |
NA |
||
| Total water sourced (excluding recycled water) |
364,414 |
||
NA = not applicable
*Data on directly abstracted water was likely to be unavailable or incomplete, and therefore not included in the scope of the National Water Account 2010The difference between the total volume of water sourced (364,414 ML) and the total volume supplied by the urban water supply system (362,468 ML) is likely to be due to unaccounted losses and limitations in the calculations of volumes sourced, received and supplied by water authorities.
Total volume supplied by the urban water supply system (362,468 ML) includes:
| Item | Water usage | Volume (ML) | Note |
|---|---|---|---|
| 1 | Residential – potable water |
227,596 |
SEW_U10 + YVW_U9 + WW_U9 + CWW_U9 |
| 2 | Residential – non-potable water |
132 |
YVW_U12 + WW_U12 |
| 3 | Commercial, industrial, municipal – potable water |
94,504 |
SEW_U10 + YVW_U10 + WW_U10 + CWW_U10 |
| 4 | Commercial, industrial, municipal – non-potable water* |
428 |
SEW_U14 + YVW_U13 + WW_U13 |
| 5 | Other including agricultural – potable water |
0 |
|
| 6 | Agricultural – non-potable water |
0 |
|
| 7 | Environment – potable water |
0 |
|
| 8 | Environment – non-potable water |
0 |
|
| Total water use via urban water supply system |
322,660 |
Items 1 + 2 + 3 + 4 |
* Includes supplies of non-potable water to residential, commercial, industrial and municipal usage from South East Water
| Item | By Western Water | Volume (ML) |
|---|---|---|
| 1 | Export of potable water to Woodend – outside the Melbourne region* |
58 |
| 2 | Export of non-potable water to Woodend – outside the Melbourne region* |
77 |
| 3 | Supply of potable water to Southern Rural Water for irrigation in Bacchus Marsh |
733 |
| 4 | Export of non-potable water to Gippsland Water from Tarago – outside the Melbourne region* |
546 |
| 5 | Supply of non-potable water – water taken from Tarago River for Southern Rural Water supply to farmers** |
150 |
| 6 | Supply of potable water to Southern Rural Water, via Western Water, to irrigators in the Bacchus Marsh Irrigation District |
735 |
* Export to outside the region totals 681 ML (items 1, 2 and 4)
** Supply within the Melbourne region not serviced via other water authorities
| Item | Wastewater produced and treated | Volume (ML) | Note |
|---|---|---|---|
| 1 | Wastewater collected within the region |
304,556 |
SEW_U19a + YVW_U19a + WW_U19a + CWW_U19a |
| 2 | Wastewater collected from outside the region |
0 |
|
| 3 | Export of wastewater outside the region |
0 |
|
| 4 | Total wastewater treated |
303,989 |
MW_U19b + SEW_U19b + YVW_U19b + WW_U19b + CWW_U19b |
| 5 | Wastewater (treated) used for recycling |
86,639 |
MW_U30 + SEW_U30 + YVW_U30 + WW_U30 + CWW_U30 |
| 6 | Wastewater (treated) discharged to surface water |
8,063 |
SEW_U22 + YVW_U22 + WW_U22 |
| 7 | Wastewater (treated) discharged to ocean |
208,934 |
MW_U23 + SEW_U23 + CWW_U23 |
| 8 | Total treated wastewater discharged |
216,997 |
Items 6 + 7 |
| Item | Recycled water produced and supplied | Volume (ML) | Disclosure |
|---|---|---|---|
| 1 | Total recycled water produced |
86,639 |
MW_U30 +SEW_U30 + YVW_U30 + WW_U30 + CWW_U30 |
| 2 | Total recycled water received from other organisations within the region)* |
270 |
SEW_U28.b + SEW_U28.c |
| 3a | Recycled water use on-site |
24,337 |
MW_U34.a |
| 3b | Recycled water use on-site in-process |
17,902 |
MW_U34.b + SEW_U34 + + YVW_U34 + WW_U34 + CWW_U34 |
| 4 | Recycled water supplied to residential |
147 |
SEW_U31 + YVW_U31 + WW_U31 |
| 5 | Recycled water supplied to commercial, industrial, municipal |
3,215 |
SEW_U32 + YVW_U32 + WW_U32 + CWW_U32 |
| 6 | Recycled water supplied to agricultural (excluding supplies to irrigation schemes) |
6,466 |
SEW_U33 + YVW_U33 + WW_U33 |
| 7 | Recycled water supplied to artificial recharge |
0 |
|
| 8 | Subtotal Recycled water supplied by urban retail water authorities |
9828 |
Items 4+5+6 |
| 9 | Recycled water supplied by Melbourne Water to irrigation (Western Treatment Plant supply to Southern Rural Water for Werribee Irrigation District 12,381 ML + Eastern Irrigation Plant supply to eastern irrigations scheme 5,182 ML) |
17,563 |
MW_U29.a |
| 10 | Recycled water supplied by Melbourne Water to urban retail water authorities** |
1,438 |
MW_U29.b |
| 11 | Recycled water supplied by Melbourne Water to Southern Rural Water (Western Treatment plant Werribee tourist precinct use) |
102 |
MW_U29.c |
| 12 | Recycled water supplied by Melbourne Water to environment |
17,199 |
MW_U33 |
| 13 | Total recycled water supplied |
46,692 |
Items 8 + 9+11 + 12 |
* Recycled water purchased from TopAq EIS and recycled water received from Inkerman Greywater Treatment Plant
** Supply by Melbourne Water to urban retail water authorities is balanced by recycled water received by South East Water and City West Water. The supply to the region is included in the urban water authority recycled water supplies for use (items 4–6)
| Losses | Volume (ML) | Note |
|---|---|---|
| Losses from potable, non-potable water supplies |
38,244 |
SEW_U11 + MW_U15 and U17 + YVW_U11 + WW_U15 and U17 + CWW_U11 |
| Losses from recycled water supplies |
– |
|
| Total water losses |
38,244 |
| Water supply service area | Water restriction level | Date restriction level implemented | Date restriction level altered |
|---|---|---|---|
| Melbourne metropolitan area | Level 3a | 01 April 07 | 02 April 10 |
| Melbourne metropolitan area | Level 3 | 02 April 10 | 01 September 10 |
| Water supply areas | Water restriction level | Date restriction level implemented | Date restriction level altered |
|---|---|---|---|
| Melton, Bacchus Marsh, Myrniong, Riddells Creek, Gisborne, Macedon and Mount Macedon, Romsey | Level 3a | 01 April 07 | 18 May 10 |
| Melton, Bacchus Marsh, Myrniong, Riddells Creek, Gisborne, Macedon and Mount Macedon, Romsey | Level 3 | 18 May 10 | 15 October 10 |
| Lancefield | 2 | 15 December 07 | 18 May 10 |
| Lancefield | In line with the Melbourne metropolitan area | 18 May 10 |
| Water use | Stage | ||
|---|---|---|---|
| 1 | 2 | 3 | |
| Watering lawns | Alternate days/restricted hours | Watering lawns is banned | |
| Reticulation watering days | Alternate days | Drippers only, 2 days/week | |
| Automatic reticulation | Midnight – 4 am | ||
| Manual reticulation | 6–8 am and 8–10 pm | ||
| Hose watering/buckets/ watering cans |
Any time | 2 days/week, 6–8 am and 8–10 pm | |
| Hosing hard surfaces | Banned at all times | ||
| Car washing | Bucket/high-pressure cleaner only; hose to rinse only | Bucket/high-pressure cleaner only | Buckets only to clean windows, mirrors and lights |
| Swimming pools | No filling without approval | ||
National Water Account 2010
Related links
Water links
