Figure 1 and tables 1–5 summarise the water distribution for Melbourne Water for 2009–10. The tables provide a breakdown for values shown in Figure 1. Notes for the values provided in tables 1–5 are available after Table 5.
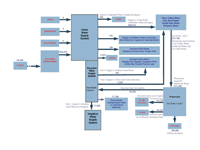
Figure 1. Urban note – summary of Melbourne Water*
*All volumes are in megalitres (ML)
Differences between the urban water distribution system components are attributed to unaccounted water losses, and limitations in the calculations of volumes sourced, treated and supplied for consumption and other uses.
Note 1: Direct comparison of the total volume of water supplied (via the urban water supply system and the recycled water supply system) and the total volume of wastewater generated in a region is not feasible due to data limitations on:
Note 2: Part of the wastewater generated in the Melbourne region is treated by the urban retail water authorities.
Note 3: Wastewater treated (271,108 ML) = effluent discharge (196,290 ML) + total recycled water produced (74,818 ML).
Note 4: Total recycled water produced (74,818 ML) = recycled water for supplies (36,302 ML) + total volume of recycled water used on-site (38,516 ML).
Note 5: Recycled water supplies (36,302 ML) = recycled water supplied to other organisations (19,103 ML) + recycled water supplied to the environment (17,199 ML).
Note 6: Recycled water supplied to other organisations (19,103 ML) = Part 1: Supply to Southern Rural Water for irrigation (17,563 ML) + Part 2: Supply to urban retail water authorities (1,438 ML) + Part 3: supply to Southern Rural Water for Werribee Tourist Precinct use (102 ML).
| Sources of water |
Volume (ML) |
Note |
|
|---|---|---|---|
| Delivered via the water supply system (connected areas) |
Water sourced from external entity |
0 |
|
| Water sourced from surface water |
363,470 |
MW_U1 |
|
| Water sourced from groundwater |
0 |
||
| Water sourced from desalination |
0 |
||
| Water sourced from recycle |
(See table 4) |
||
| Total water sourced to supply water authorities |
363,470 |
||
| Directly abstracted water * |
Water sourced from surface water |
- |
|
| Water sourced from groundwater |
- |
||
| Water sourced from farm dam |
- |
||
| Water sourced from rainwater tank |
- |
||
| Total water directly sourced |
- |
||
| Total water sourced (excluding recycled water) |
363,470 |
||
* Data on directly abstracted water are unavailable or incomplete, and therefore not included.
| Item |
Water provided |
Volume (ML) |
Note |
|---|---|---|---|
| 1 |
Portable water provided to City West Water |
90,995 |
MW_U7.a |
| 2 |
Potable water provided to South East Water |
125,239 |
MW_U7.b |
| 3 |
Potable water provided to Yarra Valley Water |
133,916 |
MW_U7.c |
| 4 |
Potable water provided to Western Water |
10,087 |
MW_U7.d |
| 5 |
Non-potable water provided to Yarra Valley Water – water taken from Maroondah aqueduct as direct supply to customers |
495 |
MW_U8.b |
| 6 |
Non-potable water provided to South East Water – water taken from Bunyip River as direct supply to customers |
84 |
MW_U8.c |
| Subtotal |
360,816 |
Items 1 + 2 + 3 + 4 + 5 + 6 |
|
| 7 |
Non-potable water provided to Gippsland Water from Tarago (export out of the Melbourne region subaccount ) |
546 |
MW_8.a |
| Subtotal: Water provided to urban retail water authorities by Melbourne Water |
361,362 |
Items 1 + 2 + 3 + 4 + 5 + 6 + 7 |
|
| 8 |
Non-potable water provided to Southern Rural Water – water taken from Tarago River for SRW supply to farmers |
150 |
MW_U8.d |
| 9 |
Potable water provided to Southern Rural Water via Western Water for supply to irrigators in the Bacchus Marsh Irrigation District |
735 |
MW_U7.e |
| 10 |
Total water exported or supplied to other water authorities within the region |
362,247 |
Items 1 + 2 + 3 + 4 + 5 + 6 + 7 + 8 + 9 |
| Item |
Wastewater received and treated |
Volume (ML) |
Note |
|---|---|---|---|
| 1 |
Wastewater received from within the region from other water authorities |
271,739 |
MW_U20 |
| 2 |
Subtotal: wastewater treated |
271,108 |
MW_U19 |
| 3 |
Wastewater treated for recycling |
74,818 |
MW_U30 |
| 4 |
Wastewater (treated) discharged to surface water |
0 |
- |
| 5 |
Wastewater (treated) discharged to ocean |
196,290 |
MW_U23 |
| 6 |
Subtotal: treated wastewater discharged |
196,290 |
Items 4+ 5 |
| Item |
Recycled water produced and supplied |
Volume (ML) |
Note |
|---|---|---|---|
| 1 |
Total recycled water produced |
74,818 |
MW_U30 |
| 2a |
Recycled water use on-site at Western Treatment Plant |
24,337 |
MW_U34.a |
| 2b |
Recycled water use on-site in-process use at Eastern Treatment Plant |
14,179 |
MW_U34.b |
| 3 |
Recycled water supplied to residential |
0 |
|
| 4 |
Recycled water supplied to commercial, industrial and municipal |
0 |
|
| 5 |
Recycled water export to agricultural |
0 |
|
| 6 |
Recycled water supplied to environment |
17,199 |
MW_U33 |
| 7 |
Recycled water supplied to artificial recharge |
0 |
|
| 8 |
Recycled water supplied to other water authorities |
19,103 |
MW_U29 |
| 9 |
Total recycled water supplied |
36,302 |
Items 6 + 8 |
| Losses |
Volume (ML) |
Note |
|---|---|---|
| Losses from potable and non-potable water supplies |
1,223 |
MW_U15 & U17 |
| Losses from recycled water supplies |
- |
|
| Total water losses |
1,223 |
MW_U1: 363,470 ML
Melbourne Water: Waterworks database.
Melbourne Water.
This item represents the total volume of surface water taken for water supply. The total volume is approximated as shown in tables 6 and 7.
| Item |
Water supply |
Volume (ML) |
Note |
|---|---|---|---|
| 1 |
Potable water provided to City West Water |
90,995 |
U7.a |
| 2 |
Potable water provided to South East Water |
125,239 |
U7.b |
| 3 |
Potable water provided to Yarra Valley Water |
133,916 |
U7.c |
| 4 |
Potable water provided to Western Water |
10,087 |
U7.d |
| 5 |
Non-potable water provided to Yarra Valley Water – water taken from Maroondah aqueduct as direct supply to customers |
495 |
U8.b |
| 6 |
Non-potable water provided to South East Water – water taken from Bunyip River as direct supply to customers |
84 |
U8.c |
| Subtotal |
360,816 |
||
| 7 |
Non-potable water provided to Gippsland Water from Tarago (export out of the Melbourne region ) |
546 |
U8.a |
| Total volume provided to urban retail water authorities from Melbourne Water |
361,362 |
| Item |
Water supply |
Volume (ML) |
Note |
|---|---|---|---|
| 8 |
Potable water provided to Southern Rural Water via Western Water for supply to irrigators in the Bacchus Marsh Irrigation District |
735 |
U7.e |
| 9 |
Non-potable water provided to Southern Rural Water – water taken from Tarago River for Southern Rural Water supply to farmers |
150 |
U8.d |
| Total volume provided to Southern Rural Water by Melbourne Water |
885 |
Melbourne Water reported estimated proportions of water released from each of the seasonal reservoirs (Table 9) as an indication of the proportion of water intake from each reservoir to supply the total volume (derived as U1). This excludes items 5 and 6 from Table 7, and Item 9 from Table 8.
| Release location |
Percentage of total released |
|---|---|
| Cardinia |
24 |
| Silvan |
30 |
| Winneke |
30 |
| Tarago |
4 |
| Yan Yean |
<1 |
| Greenvale |
11 |
| Yarra Valley (small treatment plants) |
<1 |
| Total |
100 |
In Table 9, meters are generally ultrasonic flow meters for larger pipes (greater than 600 mm diameter) and magnetic flow meters for smaller pipes (less than 600 mm diameter). Both types of meters have an accuracy of +/–1% as reported by the manufacturers.
The volume surface water taken for water supply cannot be determined directly.
MW_U5: 84,400 ML
This water is imported to the connected surface water stores within the Melbourne region, via the Sugarloaf intake, Thompson transfer, and import from Silver and Wallaby catchments, as detailed in the table below.
Melbourne Water: WaterWorks database.
Melbourne Water.
The total volume is derived as shown below.
| Import source |
Volume per year (ML) |
|---|---|
| Sugarloaf intake from Goulburn River |
16,700 |
| 62,400 | |
| Import from Silver and Wallaby catchments* |
5,300 |
| Total |
84,400 |
*estimated
Sugarloaf intake from Goulburn River
Data capture: telemetry.
Measurement description: Water is diverted from the Goulburn River to the Sugarloaf Pipeline at the Sugarloaf Pipeline Pump Station.
Measurement device: The flow from the pump station is measured using a Siemens Sitrans SONOKIT dual-beam ultrasonic flow meter.
Accuracy: +/–1%.
Data capture: telemetry.
Measurement description: The crest of the spillway chute behaves as an Ogee weir. The depth of water flowing over the weir is measured using a Mindata 2100P level sensor and is converted to flow using a stage-discharge relationship.
Measurement device: Mindata 2100P level sensor.
Accuracy: +/–2%.
Import from Silver and Wallaby catchments (estimated)
Data capture: telemetry.
Measurement description: Toorourrong Reservoir is supplied from both Silver and Wallaby creeks (in the Goulburn Basin), and the east branch of the Plenty River (in the Yarra Basin). Diversions from Silver and Wallaby creeks are estimated as 64% of the Clearwater channel flow, and from Plenty River as 36% of the Clearwater channel flow. Clearwater channel flow is measured at the Toorourrong Reservoir outlet using a level transmitter and rating table. These percentages have been based on historical records of catchment run-off.
Measurement device: level transmitter.
Accuracy: +/–1%.
Nil.
MW_U7: 360,972
Melbourne Water: Waterworks database.
Melbourne Water.
This item represents the total metered volume of potable water provided to other water authorities by Melbourne Water. Meters are mostly operated by Melbourne Water, and are located at the interface between Melbourne Water and each of the retail water authorities. The volume that is ‘billed’ to these authorities by the many billing meters operated by Melbourne Water is considered the reported volume.
The total volume is derived by the addition of the components described in the following table.
| Component |
Portable water export |
Volume (ML) |
|---|---|---|
| U7.a |
Potable water provided to City West Water |
90,995 |
| U7.b |
Potable water provided to South East Water |
125,239 |
| U7.c |
Potable water provided to Yarra Valley Water |
133,916 |
| U7.d |
Potable water provided to Western Water |
10,087 |
| U7.3 |
Potable water provided to Southern Rural Water via Western Water for supply to irrigators in the Bacchus Marsh Irrigation District |
735 |
| U7 |
Total potable water exported or supplied to water authorities within the region |
360,972 |
Billing meters are generally ultrasonic flow meters for larger pipes (greater than 600 mm diameter) and magnetic flow meters for smaller pipes (less than 600 mm diameter). Both types of meters have a notional accuracy of +/–1%.
Although water is provided to Southern Rural Water for irrigation purposes in the Bacchus Marsh Irrigation District, this water has been fully treated for consumptive use and is thus considered to be potable water. This is not a usual practice and was implemented in the 2009–10 year as a drought response measure.
Although Gippsland Water received water from the Tarago Basin in 2009–10 (546 ML), this water was not treated and thus considered non-potable.
MW_U8: 1,275 ML
Melbourne Water: Waterworks database.
Melbourne Water.
This item represents the total metered volume of non-potable water provided to water authorities by Melbourne Water. The total volume is derived by the addition of the components described in the following table.
| Component |
Water export |
Volume (ML) |
|---|---|---|
| U8.a |
Non-potable water from Tarago to Gippsland Water (export out of the Melbourne region) | 546 |
| U8.b |
Non-potable water to Yarra Valley Water – water taken from Maroondah aqueduct as direct supply to customers |
495 |
| U8.c |
Non-potable water to South East Water – water taken from Bunyip River as direct supply to customers |
84 |
| U8.d |
Non-potable water to Southern Rural Water – water taken from Tarago River for Southern Rural Water supply to farmers |
150 |
| U8 |
Total non-potable water exported or supplied to other water authorities within the region |
1,275 |
Melbourne Water releases water from the Tarago Reservoir into the Tarago River for Southern Rural Water irrigators. The point of release is a source of uncertainty.
Not disclosed.
and
MW_U15 + U17: 1,223 ML
The combined volume of U15 and U 17 is reported because the information is not available to estimate these components separately.
Melbourne Water: Waterworks database.
Melbourne Water.
This item represents the estimated losses and leakage from the water supply systems managed by Melbourne Water from intake of water for treatment from seasonal storages to the delivery of potable water to other water authorities. The total volume is derived by the addition of the components described in the following table.
| Losses from potable water supply system |
Volume (ML) |
|---|---|
| Loss of potable water from major pipes |
33 |
| Loss of potable due minor leaks |
79 |
| Loss of potable water through service reservoir and tanks water |
249 |
| Loss of potable water though operational activities |
862 |
| Total |
1,223 |
A major loss event is when a water main requires isolation for repair works. This is generally when the leakage loss rate is greater than 1 ML/d.
Melbourne Water conducts separate investigations into all losses from major pipes. For each of these investigations, the total elapsed time, size of perforation and pressure of the leak is estimated to allow water loss to be calculated.
In 2009–10, total loss through major pipe bursts was estimated to be 33 ML.
A minor loss event is when a water main does not require isolation for repair works. This is generally when the leakage loss rate is less than 1 ML/d.
For losses from minor pipes, Melbourne Water has adapted an estimation method determined by the Australian Water Association. Melbourne Water keeps records of the time taken to repair each leak in its system. In 2009–10, the total loss through minor pipe bursts was estimated to be 79 ML.
Dewatering is undertaken intermittently on service reservoirs and tanks to allow for cleaning and other maintenance works.
Service reservoirs and tanks have height meters that can accurately gauge current storage levels and water lost through dewatering. In 2009–10, total loss due to dewatering of service reservoirs and tanks was estimated to be 249 ML.
Water can be lost through system shutdowns and flushing operations, and the volume of water required to carry out such operational activities is calculated. In 2009–10, total loss through operational activities was estimated to be 862 ML.
Not disclosed.
Leakage from the non-potable water supplies is not included.
Non-potable water lost from aqueducts are not included as these are located upstream of the seasonal storages.
MW_U19: 271,108 ML
Melbourne Water: ASPEN and supervisory control and data acquisition (SCADA) databases.
Melbourne Water.
This item represents the total metered volume of wastewater treated by Melbourne Water. Wastewater is metered at the influent pump stations of both the Eastern Treatment Plant and Western Treatment Plant. The treatment plants have primary inflow metering, as well as additional metering to record the inflows should the primary metering be offline.
| Volume of wastewater treated |
Volume (ML) |
|---|---|
| Volume of wastewater treated at the Western Treatment Plant |
147,985 |
| Volume of wastewater treated at the Eastern Treatment Plant, including 14,179 ML of wastewater treated and recirculated back into the treatment plant for in-process use |
123,123 |
| Total |
271,108 |
Wastewater inflows are measured using magnetic flow meters, which are assumed to be accurate to within +/–5%.
The Western Treatment Plant logs data daily and reports quarterly. The Eastern Treatment Plant logs data daily and reports monthly. Thus, metering periods align with the reporting period.
MW_U20: 271,739 ML
Melbourne Water: ASPEN and supervisory control and data acquisition (SCADA) databases.
Melbourne Water.
This item represents the total metered volume of wastewater received by Melbourne Water. Wastewater is metered at the influent pump stations of both the Eastern and Western treatment plants. These plants have primary inflow metering, as well as additional metering to record the inflows should the primary metering be offline.
| Volume of wastewater received |
Volume (ML) |
|---|---|
| Volume of wastewater received at the Western Treatment Plant |
162,795 |
| Volume of wastewater received at the Eastern Treatment Plant |
108,944 |
| Total volume of wastewater received |
271,739 |
Wastewater inflows are measured using magnetic flow meters, which are assumed to be accurate to within +/–5%.
The total volume includes 57 ML/year of wastewater, which is an estimated volume based on historical averages, from City West Water that enters the Western Treatment Plant downstream of the billing meter.
The Western Treatment Plant logs data daily and reports quarterly. The Eastern Treatment Plant logs data daily and reports monthly. Thus, metering periods align with the reporting period.
MW_U23: 196,290 ML
Melbourne Water: ASPEN and supervisory control and data acquisition (SCADA) databases.
Melbourne Water.
This item represents the total volume of wastewater discharge to the sea from Melbourne Water’s wastewater treatment plants.
| Wastewater discharged to sea |
Volume (ML) |
|---|---|
| Volume of treated wastewater discharge to the sea from the Western Treatment Plant |
93,663 |
| Volume of treated wastewater discharge to the sea from the Eastern Treatment Plant |
102,627 |
| Total volume of wastewater discharge |
196,290 |
Not disclosed.
This item is determined using a mass-balance calculation of all wastewater collected, treated, stored and recycled. Therefore, uncertainty depends on the associated uncertainty of items U19, U20, U23, U29, U30, U33 and U34.
MW_U29: 19,103 ML
Various utility databases (where they are receiving recycled water).
Melbourne Water.
This item represents the total metered volume of recycled water provided to water authorities from Melbourne Water’s wastewater treatment plants. All water that is recycled for supply to other water authorities is measured with magnetic flow meters at the interface of Melbourne Water and the receiving authority.
| Recycled water supplied to water authorities |
Volume (ML) |
|
|---|---|---|
| Part 1: Recycled water supplied to irrigation |
Western Treatment Plant to Southern Rural Water – Werribee Irrigation District |
12,381 |
| Eastern Treatment Plant to Eastern Irrigation Scheme |
5,182 |
|
| Subtotal |
17,563 |
|
| Part 2: Recycled water supplied to urban retail water authorities |
Western Treatment Plant to City West Water for usage via City West Water supplies |
303 |
| Eastern Treatment Plant to South East Water to south eastern outfall – usage via South East Water supplies |
1135 |
|
| Subtotal |
1,438 |
|
| Part 3: Recycled water supplied to Southern Rural Water |
Western Treatment Plant to Southern Rural Water – Werribee Tourist Precinct use |
102 |
| Total |
19,103 |
|
Magnetic flow meters are used to measure these flows and are assumed to have an accuracy of +/–1 to +/–2%.
The Western Treatment Plant logs data daily and reports quarterly. The Eastern Treatment Plant logs data daily and reports monthly. Thus, metering periods align with the reporting period.
MW_U30: 74,818 ML
Melbourne Water: ASPEN and supervisory control and data acquisition (SCADA) databases.
Various utility databases (where they are receiving recycled water).
Melbourne Water.
This item represents the total metered volume of recycled water produced by Melbourne Water’s wastewater treatment plants. This value is the total of all the individual recycled water uses from both the Eastern and Western treatment plants. All water that is recycled for supply to other water authorities is measured by the receiving authority with magnetic flow meters at the interface of Melbourne Water and the receiving authority.
| Recycled water produced |
Volume (ML) |
|---|---|
| Total recycled water produced at Western Treatment Plant |
54,322 |
| Total recycled water produced at Eastern Treatment Plant* |
20,496 |
| Total |
74,818 |
The accuracy assumed for this form of metering is assumed to be +/–5 to +/–10%.
As for U29, U33 and U34.
MW_U33: 17,199 ML
Melbourne Water: supervisory control and data acquisition (SCADA) database.
Melbourne Water.
This item represents the total metered volume of recycled water supplied for environment. Water recycled and used for conservation flows is metered using an ultrasonic level transmitter. This recycled is measured by Melbourne Water before being discharged to the Lake Borrie wetlands (Ramsar listed).
| Recycled water supplied for environment |
Volume (ML) |
|---|---|
| Volume of recycled water provided from the Western Treatment Plant as conservation flows to the Lake Borrie wetlands within the Western Treatment Plant |
17,199 |
| Total |
17,199 |
Ultrasonic level transmitters are used to measure flows and are assumed to have an accuracy of +/–5 to +/–10%.
Data are logged daily and reported quarterly, and thus metering periods align with the reporting period.
MW_U34: 38,516 ML
Melbourne Water: ASPEN and supervisory control and data acquisition (SCADA) databases.
Melbourne Water.
This item represents the total metered volume of recycled water used on-site for wastewater treatment processes at Melbourne Water’s wastewater treatment plants.
On-site recycled water is measured by Melbourne Water at the Eastern and Western treatment plants, using ultrasonic level transmitters.
| Recycled water used on-site or in-process |
Volume (ML) |
|---|---|
| U34.a Volume of recycled water used on-site at Western Treatment Plant |
24,337 |
| U34.b Volume of recycled water used on-site in-process at Eastern Treatment Plant |
14,179 |
| Total volume of recycled water used on-site |
38,516 |
Ultrasonic level transmitters are used to measure flows and are assumed to have an accuracy of +/–5 to +/–10%.
The Western Treatment Plant logs data daily and reports quarterly. The Eastern Treatment Plant logs data daily and reports monthly. Thus, metering periods align with the reporting period.
National Water Account 2010
Related links
Water links
