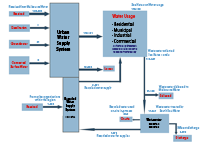
Figure 1: UrbanSAT – summary of South East Water*
Differences between the urban water distribution system components are attributed to unaccounted water losses, and limitations in the calculations of volumes sourced, treated and supplied for consumption and other uses.
| Sources of water |
Volume (ML) |
Note |
|
|---|---|---|---|
| Delivered via the water supply system (connected areas) |
Water sourced from external entity (Melbourne Water) |
125,325 |
SEW_U4+ SEW_U5 |
| Water sourced from surface water |
0 |
||
| Water sourced from groundwater |
21 |
SEW_U2 |
|
| Water sourced from desalination |
0 |
||
| Water sourced from recycle |
See Table 4 |
||
| Total water sourced to supply connected areas |
125,346 |
||
| Directly abstracted water* |
Water sourced from surface water |
- |
|
| Water sourced from groundwater |
- |
||
| Water sourced from farm dam |
- |
||
| Water sourced from rainwater tank |
- |
||
| Total water directly sourced |
- |
||
| Total water sourced (excluding recycled water) |
125,346 |
||
| Item |
Water usage |
Volume (ML) |
Note |
|---|---|---|---|
| 1 |
Residential – potable water |
83,818 |
SEW_U9 |
| 2 |
Residential – non-potable water |
(included in item 4) |
|
| 3 |
Commercial, industrial, municipal – potable water |
28,741 |
SEW_U10 |
| 4 |
Commercial, industrial, municipal – non-potable water* |
102 |
SEW_U14 |
| 5 |
Other including agricultural – potable water |
0 |
|
| 6 |
Agricultural – non potable water |
0 |
|
| 7 |
Environment – potable water |
0 |
|
| 8 |
Environment – non potable water |
0 |
|
| Total |
112,661 |
Items 1 + 3 + 4 |
| Item |
Wastewater collected and treated |
Volume (ML) |
Note |
|---|---|---|---|
| 1 |
Wastewater collected by South East Water |
103,287 |
SEW_U19a |
| 2 |
Wastewater received from other water authorities in the region |
0 |
|
| 3 |
Wastewater delivered to Melbourne Water |
91,800 |
SEW_U21 |
| 4 |
Subtotal wastewater treated |
11,487 |
Item 1 – 3, SEW_U19b |
| 5 |
Wastewater treated for recycling |
2,904 |
SEW_U30 |
| 6 |
Wastewater (treated) discharged to surface water |
792 |
SEW_U22 |
| 7 |
Wastewater (treated) discharged to ocean |
8,060 |
SEW_U23 |
| 8 |
Subtotal treated wastewater discharged |
8,852 |
Items 6 + 7 |
| Item |
Recycled water produced and supplied |
Volume (ML) |
Note |
|---|---|---|---|
| 1 |
Total recycled water produced |
2,904 |
SEW_U30 |
| 2 |
Total recycled water received from other organisations within the region |
1,405 |
SEW_U28 |
| 3 |
Recycled water use on-site in-process |
928 |
SEW_U34 |
| 4 |
Recycled water supplied to residential |
117 |
SEW_U31 |
| 5 |
Recycled water supplied to commercial, industrial, municipal |
1,659 |
SEW_U32 |
| 6 |
Recycled water supplied to agricultural |
1,605 |
SEW_U33 |
| 7 |
Recycled water supplied to environment |
0 |
|
| 8 |
Recycled water supplied to artificial recharge |
0 |
|
| 9 |
Total recycled water supplied |
3,381 |
Items 4 + 5 + 6 |
| Losses |
Volume (ML) |
Disclosure |
|---|---|---|
| Losses from potable, non-potable water supplies* |
12,685 |
SEW_U11 |
| Losses from recycled water supplies |
0 |
|
| Total water losses |
12,685 |
SEW_U2: 21 ML
South East Water: database.
South East Water.
This item represents the smart meter (real-time) metered volume of water extracted from the Lang Lang bore.
| Water taken from groundwater |
Volume (ML) |
|---|---|
| Groundwater extracted from Lang Lang bore |
21 |
| Total |
21 |
Meter type: Elster R2000 100 mm; uncertainty is +/–2%.
Assumes the meters and readings are accurate.
SEW_U4: 125,244 ML
Melbourne Water: database.
Melbourne Water.
This item represents the weekly metered volume of bulk water supplied by Melbourne Water as contained in weekly invoices. The meter network and locations are contained in a bulk supply agreement with South East Water.
+/–5% in accordance with an independent, annual audit. The Summary Audit Report – Regulatory Audit of AGL Energy Limited, October 2010 (ESC 2010) indicated that reliability and accuracy for metered volume of potable water delivered as +/–5% (i.e. Grade 2).
Assumes any errors in invoices are corrected in the next invoice. Data reported from 01 July 2009 – 30 June 2010.
SEW_U5: 81 ML
Supporting information as supplied under U14 Component 1.
As above.
SEW_U9: 83,818 ML
South East Water: HiAffinity database (South East Water billing system).
South East Water.
The item represents the quarterly metered volume of potable water supplied for residential use. Most of the meters were located at property boundaries.
+/–5% in accordance with an independent, annual audit. The Summary Audit Report – Regulatory Audit of AGL Energy Limited, October 2010 (ESC 2010) indicated that reliability and accuracy for metered volume of potable water delivered is +/–5% (i.e. Grade 2).
Assumes meters and readings are accurate.
Data reported from 01 July 2009 – 30 June 2010 are based on the four quarterly readings on each property. The water year for properties read early in the cycle starts in April and are billed in July), and the later reads in the cycle have a meter year that starts in June and is billed in September.
Some quarterly readings are estimated (due to issues including inability to access meter) but will be adjusted in following periods.
SEW_U10: 28,741 ML
South East Water: HiAffinity database (South East Water billing system).
South East Water.
The item represents the quarterly (some large users are monthly) metered volume of potable water supplied for commercial, industrial and municipal use. Most of the meters were located at property boundaries.
+/–5% in accordance with an independent, annual audit. The Summary Audit Report – Regulatory Audit of AGL Energy Limited, October 2010 (ESC 2010) indicated that reliability and accuracy for metered volume of potable water delivered is +/–5% (i.e. Grade 2).
Assumes meters and readings are accurate.
SEW_U11: 12,685 ML
South East Water: database.
South East Water.
This item represents the volume of nonrevenue water (bulk water supplied minus water sales).
+/–5% in accordance with an independent, annual audit. The Summary Audit Report – Regulatory Audit of AGL Energy Limited, October 2010 (ESC 2010) indicated that reliability and accuracy for metered volume of potable water delivered is +/–5% (i.e. Grade 2).
Nonrevenue water includes infrastructure leakage, pipe burst, thefts and leak allowances.
SEW_U14: 102 ML
South East Water: HiAffinity database (South East Water billing system).
South East Water.
This item represents the total volume of non-potable water supplied for customers (U12 + U13) for residential, commercial, industrial and municipal use, and includes the following components:
| Non-potable water supplied other than for residential, commercial, municipal and industrial use |
Volume (ML) |
|---|---|
| Component (1) Supply of water taken from Bunyip River |
81 |
| Component (2) Supply of groundwater extracted from Lang Lang bore |
21 |
| Total |
102 |
Component (1): +/–5% in accordance with an independent, annual audit.
Component (2): +/–2% (meter type is an Elster R2000 100mm).
Assumes meters and readings are accurate.
SEW_15: 7,885 ML
South East Water: various internal sources and the database.
South East Water.
This item represents the estimated leakage component of nonrevenue water (based on the Water Services Association of Australia Benchloss software).
+/–10% in accordance with an independent, annual audit.
As appropriate to the standard method.
SEW_17: 1,156 ML
South East Water: various internal sources and the database.
South East Water.
This item represents the estimated pipe bursts component of nonrevenue water. The volume is estimated using a spreadsheet calculator based on multiple inputs in line with Infrastructure Leakage Index (ILI) standards.
The International Water Association has developed the ILI indicator to better represent the performance of water supply systems and their management in terms of leakage. The ILI is defined as the ratio of Current Annual Real Losses (CARL) to Unavoidable Annual Real Losses (UARL). CARL are determined from a conventional water balance undertaken on an annual basis. The UARL is a formula that accounts for the number of connections, the length of water mains and the average system operating pressure.
+/–10% in accordance with and independent, annual audit. The Summary Audit Report – Regulatory Audit of AGL Energy Limited, October 2010 (ESC 2010) indicated that reliability and accuracy for the calculation of losses is +/–10% (i.e. Grade 3).
As appropriate to the standard method.
SEW_U19a: 103,287 ML
South East Water: database.
South East Water and Melbourne Water.
Sewage from South East Water customers is collected in its sewerage system and then transferred to Melbourne Water for further transport, treatment and disposal, or to South East Water for further transport, treatment and disposal. The data have been sourced from both providers as outlined in the ‘Method’ section.
Meter readings. This item represents the daily metered volume of wastewater collected and treated at South East Water’s sewage treatment plants, plus the weekly invoice volume of wastewater exported to Melbourne Water’s Eastern and Western treatment plants.
Melbourne Water has a suite of bulk meters and formulas in order to attribute volumes to the three retailers. The meter network and locations are contained in a bulk supply agreement with South East Water.
| Wastewater collected |
Volume (ML) |
|---|---|
| Wastewater collected and treated at South East Water’s sewage treatment plants |
11,487 |
| Wastewater collected and exported to Melbourne Water’s Western Treatment Plant |
24,900 |
| Wastewater collected and exported to Melbourne Water’s Eastern Treatment Plant |
66,900 |
| Total |
103,287 |
+/–5% in accordance with and independent, annual audit.
Assumes meters and readings are accurate. The total volume (103,287 ML) reflects the volume of wastewater received from South East Water customers. Collection for disposal has been allocated to South East Water and Melbourne Water.
SEW_U19b: 11,487 ML
South East Water: database.
South East Water.
This item represents the daily metered volume of wastewater treated at South East Water sewage treatment plants.
| Sewage treatment plant |
Volume (ML) |
|---|---|
| Blind Bight |
168 |
| Hastings (Somers) |
1,558 |
| Koo Wee Rup |
132 |
| Lang Lang |
59 |
| Longwarry |
182 |
| Mornington (Mount Martha) |
4,327 |
| Pakenham (Deep Creek) |
2,008 |
| Rosebud (Boneo) |
3,054 |
| Total |
11,487 |
+/–5% in accordance with an independent, annual audit.
Assumes meters and readings are accurate.
U19a indicates the volume collected by South East Water (103,287 GL) and U19b indicates the volume treated by South East Water (11,487 GL).
SEW_U21: 91,800 ML
Databases.
South East Water and Melbourne Water.
Meter readings. This item represents the weekly invoice volume of wastewater exported to Melbourne Water’s Eastern and Western treatment plants.
Melbourne Water has a suite of bulk meters and formulae in order to attribute volumes to the three retailers. The meter network and locations are contained in a bulk supply agreement with South East Water.
| Location wastewater was exported to |
Volume (ML) |
|---|---|
| Western Treatment Plant (Melbourne Water) |
24,900 |
| Eastern Treatment Plant (Melbourne Water) |
66,900 |
| Total wastewater delivered to Melbourne Water |
91,800 |
+/–5% in accordance with an independent, annual audit.
Assumes meters and readings are accurate.
SEW_U22: 792 ML
South East Water: database.
South East Water.
This item represents the daily metered volume of treated wastewater discharged to Deep Creek and Yallock Creek.
| Wastewater discharged to surface water |
Volume (ML) |
|---|---|
| Pakenham Sewage Treatment Plant to Deep Creek |
792 |
| Koo Wee Rup Sewage Treatment Plant Yallock Creek – Koo Wee Rup |
0 |
| Total discharge |
792 |
+/–5% in accordance with and independent, annual audit.
Assumes meters and readings are accurate.
SEW_U23: 8,060 ML
South East Water: database.
South East Water.
This item represents the daily metered volume of treated wastewater discharged to the sea from the South East Outfall.
U23 table:
| Discharge to sea from South East Outfall |
Volume (ML) |
|---|---|
| Hastings (Somers) Sewage Treatment Plant |
1,154 |
| Mornington (Mount Martha) Sewage Treatment Plant |
4,273 |
| Rosebud (Boneo) Sewage Treatment Plant |
2,633 |
| Total |
8,060 |
+/–5% in accordance with an independent, annual audit.
Assumes meters and readings are accurate.
This item only refers to wastewater volumes directly managed by South East Water (see item U19b).
SEW_U28: 1,405 ML
Spreadsheet.
South East Water.
This item represents the quarterly metered volume of recycled water purchased from Melbourne Water’s South East Outfall and TopAq Eastern Irrigation Scheme, and received from Inkerman Greywater Treatment Plant.
| Recycled water received from other organisations within the region |
Volume (ML) |
|---|---|
| U28.a: Recycled water purchased from Melbourne Water’s South Eastern Outfall |
1,135 |
| U28.b: Recycled water purchased from TopAq Eastern Irrigation Scheme |
268 |
| U28.C: Recycled water received from Inkerman Greywater Treatment Plant |
2 |
| Total |
1,405 |
+/–5% in accordance with an independent, annual audit.
Assumes meters and readings are accurate.
The TopAq Eastern Irrigation Scheme meter-reading cycle does not align with the 01 July 2009 – 30 June 2010 reporting year; however, it does cover a 12-month period that is consistently applied each year.
SEW_U30: 2,904 ML
Spreadsheet.
South East Water.
This item represents the monthly metered volume of recycled water produced at South East Water’s sewage treatment plants.
| Recycled water produced |
Volume (ML) |
|---|---|
| South East Water’s sewage treatment plants |
2,904 |
| Total |
2,904 |
+/–5% in accordance with an independent, annual audit.
Assumes meters and readings are accurate.
SEW_U31: 117 ML
South East Water: HiAffinity database (South East Water billing system).
South East Water.
This item represents the quarterly metered volume of recycled water supplied for residential use. br>
+/–5% in accordance with an independent, annual audit.
Assumes meters and readings are accurate.
SEW_U32: 1,659 ML
South East Water: database.
South East Water.
This item represents the quarterly or monthly metered volume of recycled water supplied for commercial, industrial and municipal use.
+/–5% in accordance with an independent, annual audit.
Assumes meters and readings are accurate.
SEW_U33: 1,605 ML
South East Water: database.
South East Water.
This item represents the quarterly metered volume of recycled water supplied for agricultural use.
+/–5% in accordance with an independent, annual audit.
Assumes meters and readings are accurate.
SEW_U34: 928 ML
South East Water: database.
South East Water.
This item represents the daily metered volume of recycled water used for in-process water at South East Water’s sewage treatment plants.
| Sewage treatment plant |
Volume (ML) |
|---|---|
| Blind Bight |
50 |
| Hastings (Somers) |
8 |
| Koo Wee Rup |
0 |
| Lang Lang |
0 |
| Longwarry |
0 |
| Mornington (Mount Martha) |
808 |
| Pakenham (Deep Creek) |
32 |
| Rosebud (Boneo) |
29 |
| Total |
928 |
+/–5% in accordance with an independent, annual audit.
Assumes meters and readings are accurate.
SEW_U35: 0 ML
South East Water: database.
South East Water.
This item represents the volume of nonrevenue water with respect to the supply of recycled water. The nonrevenue component of recycled water supply is calculated as the difference between the volume of recycled water produced and/or purchased, and the volume of recycled water supplied to customers.
+/–10% in accordance with an independent, annual audit.
Assumptions are based on mass-balance calculation formulas.
National Water Account 2010
Related links
Water links
