Figure 1 and tables 1–5 summarise the water distribution for Western Water for 2009–10. The tables provide a breakdown for values shown in Figure 1. Notes for the values provided in tables 1–5 are available after Table 5.
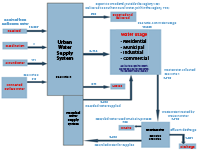
Figure 1. Urban note – summary of Western Water*
*All volumes are in megalitres (ML)
Differences between the urban water distribution system components are attributed to unaccounted water losses, and limitations in the calculations of volumes sourced, treated and supplied for consumption and other uses.
Note 1: Direct comparison of the total volume of water supplied (via the urban water supply system and the recycled water supply system) and the total volume of wastewater generated is not feasible due to data limitations on:
Note 2: Surface water taken for water supply by Western Water (812 ML) equals the volume taken from Merrimu, Rosslynne, Pykes Creek, Kerrie, Djerriwarrah, Garden Hut and Wright reservoirs (and treated at the Myrniong, Merrimu, Rosslynne, Romsey and Lancefield water treatment plants), and water taken from Macedon storage for supply of nonpotable water to Woodend.
Note 3: Intake to the urban water supply system (IN) = volume received from Melbourne Water (10,607 ML) + volume taken from groundwater (111 ML) + volume taken from surface water (812 ML) = 11,530 ML.
Outflow from the urban water supply system (OUT) =volume exported out of the region and delivered to Southern Rural Water (868 ML) + volume supplied (9,714 ML) + losses (971 ML) = 11,553 ML.
Losses indicated represent the water loss and leakage volume applicable to the entire area supplied by Western Water, and hence it is an overestimation of the losses applicable to the service area within the region and thus the OUT component. The difference between IN and OUT is likely to be due to limitations in the estimation of losses and calculations of volumes sourced, delivered and supplied, or consumption.
Note 4: Total water usage (15,065 ML) is estimated as: (1) volume of water supplied via the urban water supply system excluding losses (9,714 ML) plus (2) volume of water supplied via the recycled water supply system (5,351 ML).
Note 5: (1) Volume of wastewater treated by Western Water (7,759 ML); (2) volume of effluent discharge (1,021 ML) + volume of recycled water produced (6,124 ML) = 7,145 ML. The difference between (1) and (2) is attributed to the loss of wastewater for biosolids, seepage and other unaccounted losses, and uses including process water used for washdown.
Note 6: (1) Volume of recycled water produced (6,124 ML); (2) volume of recycled water used on-site (782 ML) + volume of recycled water for supplies (5,351 ML) = 6,133 ML. The difference between (1) and (2) is likely to be due to that part of the recycled water used on-site re-enters the wastewater treatment process, and errors in the calculation of recycled water volumes.
| Sources of water | Volume (ML) | Note | |
|---|---|---|---|
| Delivered via the water supply system (connected areas) | Water sourced from external entity (Melbourne Water) |
10,607 |
WW_U4 |
| Water sourced from surface water |
812 |
WW_U1 |
|
| Water sourced from groundwater |
111 |
WW_U2 |
|
| Water sourced from desalination |
0 |
|
|
| Water sourced from recycling |
See Table 4 |
|
|
| Total water sourced to supply connected areas |
11,530 |
Items 1 +2+ 3 |
|
| Directly abstracted water* | Water sourced from surface water |
– |
|
| Water sourced from groundwater |
– |
|
|
| Water sourced from farm dam |
– |
|
|
| Water sourced from rainwater tank |
– |
|
|
| Total water directly sourced |
– |
|
|
|
Total water sourced (excluding recycled water) |
11,530 |
|
|
| Item | Water usage | Volume (ML) | Note |
|---|---|---|---|
| 1 | Residential – potable water |
7,909 |
WW_U9 |
| 2 | Residential – non-potable water |
77 |
WW_U12 |
| 3 | Commercial, industrial, municipal – potable water |
1,719 |
WW_U10 |
| 4 | Commercial, industrial, municipal – non-potable water |
9 |
WW_U13 |
| 5 | Other including agricultural – potable water |
0 |
|
| 6 | Agricultural – non-potable water |
0 |
|
| 7 | Environment – potable water |
0 |
|
| 8 | Environment – non-potable water |
0 |
|
| Total water use via urban water supply system |
9,714 |
Items 1 + 2 + 3 + 4 |
| Water export or supply | Volume (ML) | Note |
|---|---|---|
| Export of potable water to Woodend – outside the Melbourne region |
58 |
WW_U7.a |
| Supply of potable water to Sothern Rural Water for irrigation in Bacchus Marsh |
733 |
WW_U7.b |
| Export of non-potable water to Woodend – outside the Melbourne region |
77 |
WW_U8 |
| Total water export or supply to other water authorities for non-urban purposes |
868 |
| Item | Wastewater produced and treated | Volume (ML) | Note |
|---|---|---|---|
| 1 | Wastewater collected within the entity |
7,759 |
WW_U19a |
| 2 | Wastewater collected from external entity |
0 |
|
| 3 | Total wastewater treated |
7,759 |
WW_U19b |
| 4 | Wastewater treated for recycling |
6,124 |
WW_U30 |
| 5 | Wastewater (treated) discharged to surface water |
1,021 |
WW_U22 |
| 6 | Wastewater (treated) discharged to ocean |
0 |
|
| Total treated wastewater discharged |
1,021 |
Items 5 + 6 |
| Item | Recycled water produced and supplied | Volume (ML) | Note |
|---|---|---|---|
| 1 | Total recycled water produced |
6,124 |
WW_U30 |
| 2 | Recycled water use on-site in-process |
782 |
WW_U34 |
| 3 | Recycled water supplied to residential |
9 |
WW_U31 |
| 4 | Recycled water supplied to commercial, industrial, municipal |
730 |
WW_U32 |
| 5 | Recycled water supplied to agricultural |
4,612 |
WW_U33 |
| 6 | Recycled water supplied to environment |
0 |
|
| 7 | Recycled water supplied to artificial recharge |
0 |
|
| 8 | Total recycled water supplied |
5,351 |
Items 3+4+5 |
| Losses | Volume (ML) | Note |
|---|---|---|
| Losses from potable, non-potable water supplies |
971 |
WW_U15+ WW_U17 |
| Losses from recycled water supplies |
– |
|
| Total water losses |
971 |
WW_U1: 812 ML
Western Water: metering database.
Southern Rural Water: database.
Western Water.
This item represents the total weekly metered volume of surface water taken from Merrimu, Rosslynne, Pykes Creek, Kerrie, Djerriwarrah, Garden Hut and Wright reservoirs, and treated at the Myrniong, Merrimu, Rosslynne, Romsey and Lancefield water treatment plants. It also represents water taken from Macedon storage for non-potable water provided to Woodend. Meters are located on outlet pipes from reservoirs.
| Surface water taken for water supply | Volume (ML) | |
|---|---|---|
| U1.a Volume taken from surface water storages | Southern Rural Water | 423 |
| Western Water | 312 | |
| Total | 735 | |
| U1.b Volume taken from Macedon storage* | 77 | |
| Total | 812 | |
* Equals non-potable water provided to Woodend (U8)
+/–5% in accordance with Water Industry Regulatory Audits 2010.
Nil.
WW_U2: 111 ML
Western Water: IT database.
Southern Rural Water: database.
Western Water.
This item represents the total metered volume of groundwater taken from two Lancefield bores. Meters are located on pipes between the bores and the water treatment facility. Meter readings are recorded daily.
+/–5% in accordance with Summary Audit Report – Regulatory Audit of AGL Energy Limited, October 2010 (ESC 2010).
Nil.
WW_U4: 10,607 ML
Western Water: IT database.
Melbourne Water: database.
Western Water.
This item represents the total metered volume of potable water imported from Melbourne Water. Meters are located at Loemans Road and Hillside pumping stations. Readings are recorded monthly, weekly and daily.
| Potable water imported | Volume (ML) |
|---|---|
| U4.a Potable water imported to Western Water from Melbourne Water |
9,874 |
| U4.b Potable water imported from Melbourne Waterto supply Southern Rural Water for the Bacchus Marsh Irrigation District |
733 |
| Total |
10,607 |
+/–5% in accordance with Water Industry Regulatory Audits 2010.
Nil.
WW_U7: 791 ML
Western Water: IT database.
Southern Rural Water: database (Bacchus Marsh Irrigation).
Western Water.
This item represents the total metered volume of potable water exported out of the region or supplied to other water authorities within the region by Western Water. Meters are located on inflow pipelines to Woodend reservoirs. Weekly readings are taken from these meters.
| Potable water exported or supplied to other water authorities within the region | Volume (ML) |
|---|---|
| U7.a Potable water supply to Woodend |
58 |
| U7.b Potable water supply to Southern Rural Water for Bacchus Marsh Irrigation District (imported from Melbourne Water) |
733 |
| Total water exported or supplied to other water authorities within the region |
791 |
+/–5% in accordance with Summary Audit Report – Regulatory Audit of AGL Energy Limited, October 2010 (ESC 2010).
Nil.
WW_U8: 77 ML
Western Water: IT database.
Western Water.
This item represents the total metered volume of non-potable water supplied to Woodend, which is outside the Melbourne region. This water taken from Mount Macedon water storage is included as part of item U1. Meters are read weekly.
+/–5% in accordance with Summary Audit Report – Regulatory Audit of AGL Energy Limited, October 2010 (ESC 2010).
Nil.
WW_U9: 7,909 ML
Western Water: IT database.
Western Water.
This item represents the total, monthly and four-monthly metered volume of potable water supplied for residential use, excluding potable water supplied to Woodend (included in U7 as an export).
+/–5% in accordance with Summary Audit Report – Regulatory Audit of AGL Energy Limited, October 2010 (ESC 2010).
Total volume reported for the 2009–10 reporting year was approximated based on the meter readings.
WW_U10: 1,719 ML
Western Water: IT database.
Western Water.
This item represents the total metered volume of potable water supplied for commercial, industrial and municipal use, but excludes potable water supplied to Woodend (included in U7 as an export). Meters are located at the owners’ individual properties. Meters are read every four months.
+/–5% in accordance with Summary Audit Report – Regulatory Audit of AGL Energy Limited, October 2010 (ESC 2010).
Total volume reported for 2009–10 was approximated based on the meter readings.
WW_U12: 77 ML
Western Water: IT database.
Western Water.
This item represents the total four-monthly metered volume of non-potable water supplied to residential customers with unchlorinated water service agreements. This water was supplied after the intake from Garden Hut Reservoir, but before delivery to the Lancefield Treatment Plant.
+/–5% in accordance with Summary Audit Report – Regulatory Audit of AGL Energy Limited, October 2010 (ESC 2010).
Nil.
WW_U13: 9 ML
Western Water: IT database.
Western Water.
This item represents the total weekly metered volume of non-potable water supplied for sporting grounds after the intake from Djerriwarrah Reservoir, and before delivery to the customer.
+/–5% in accordance with Summary Audit Report – Regulatory Audit of AGL Energy Limited, October 2010 (ESC 2010).
Nil.
WW_U15: 964 ML
Western Water: IT database.
Western Water.
This item represents the estimated leakage from the entire area supplied by Western Water, including the area outside of the Melbourne region sub-account (i.e. Woodend).
Background leakage is calculated by deducting volumes from the bulk meter totals, and deducting all metered usage and estimated losses downstream of bulk meters.
Urban water region note item U15 represents the volume of leakage applicable to the entire area supplied by Western Water in the Melbourne region. As such, it is an overestimate of the volume of leakage applicable to the area within the region.
WW_U17: 7 ML
Western Water: IT database.
Western Water.
This item represents the estimated losses from pipe bursts in the entire area supplied by Western Water, including the area outside the Melbourne region (i.e. Woodend).
Losses are estimated by totalling all bulk meters, deducting metered totals downstream, and deducting estimated background leakage.
Urban water region note U17 represents the volume of losses applicable to the entire area supplied by Western Water in the Melbourne region. As such, it is an overestimate of the volume of losses applicable to the area within the region.
and
WW_U19a: 7,759 ML
WW_U19b: 7,759 ML
Western Water: plant data.
Western Water.
This item represents the total volume of wastewater entering wastewater treatment plants within the Melbourne region (excluding Woodend). Meters are at the entrance to the plant and record all incoming water. Meters are read daily by the treatment plant operators.
| Wastewater treatment plant | Volume (ML) |
|---|---|
| Bacchus Marsh |
991 |
| Melton |
3905 |
| Riddells Creek |
187 |
| Romsey |
316 |
| Sunbury |
1,842 |
| Gisborne |
518 |
| Total |
7,759 |
+/–5% in accordance with Summary Audit Report – Regulatory Audit of AGL Energy Limited, October 2010 (ESC 2010).
Nil.
WW_U22: 1,021 ML
Western Water: plant data.
Western Water.
This item represents the metered volume of treated wastewater discharged to surface water from Western Water’s wastewater treatment plants in the Melbourne region. Meters are located at the outlet of the treatment plants and are read daily by the treatment plant operators.
| Treated wastewater discharged to surface water | Volume (ML) |
|---|---|
| Sunbury Wastewater Treatment Plant to Jacksons Creek at Sunbury |
806 |
| Gisborne Wastewater Treatment Plant to Jacksons Creek at Gisborne |
215 |
| Total discharge |
1021 |
+/–5% in accordance with Summary Audit Report – Regulatory Audit of AGL Energy Limited, October 2010 (ESC 2010).
Nil.
WW_U30: 6,124ML
Western Water: plant data.
Western Water.
This item represents the total metered volume of recycled water produced from Western Water’s wastewater treatment plants in the Melbourne region (i.e. does not include Woodend). Meters are at the outlet of the plant and are read daily by the treatment plant operators.
| Recycled water produced | Volume (ML) |
|---|---|
| Bacchus Marsh |
698 |
| Melton |
3,644 |
| Riddells Creek |
161 |
| Romsey |
331 |
| Sunbury |
999 |
| Gisborne |
291 |
| Total |
6,124 |
+/–5% in accordance with Summary Audit Report – Regulatory Audit of AGL Energy Limited, October 2010 (ESC 2010).
Assumes losses of 2% for biosolids and seepage.
WW_U31: 9 ML
Western Water: water usage spreadsheet.
Western Water.
This item represents the total metered volume of recycled water supplied for residential use. The meter is located at the outflow from the class tank. All nonresidential volumes are subtracted, leaving a residential use total. Meters are read monthly.
+/–5% in accordance with Summary Audit Report – Regulatory Audit of AGL Energy Limited, October 2010 (ESC 2010).
Nil.
WW_U32: 730 ML
Western Water: water usage spreadsheet.
Western Water.
This item represents the total metered volume of recycled water supplied for commercial, industrial and municipal uses. Meters are located at customer properties and are read monthly.
+/–5% in accordance with Summary Audit Report – Regulatory Audit of AGL Energy Limited, October 2010 (ESC 2010) .
Nil.
WW_U33: 4,612 ML
Western Water: water usage spreadsheet.
Western Water.
This item represents the total metered volume of recycled water supplied for agricultural use. Meters are located at customer properties and are read monthly.
+/–5% in accordance with Summary Audit Report – Regulatory Audit of AGL Energy Limited, October 2010 (ESC 2010).
Nil.
WW_U34: 782 ML
Western Water: water usage spreadsheet.
Western Water.
This item represents the total metered volume of recycled water used on-site for wastewater treatment processes at Western Water’s wastewater treatment plants in the Melbourne region. Meters are read monthly.
| Recycled water used on-site in-process | Volume (ML) |
|---|---|
| Bacchus Marsh |
0 |
| Melton |
167 |
| Riddells Creek |
110 |
| Romsey |
0 |
| Sunbury |
282 |
| Gisborne |
223 |
| Total |
782 |
+/–5% in accordance with Summary Audit Report – Regulatory Audit of AGL Energy Limited, October 2010 (ESC 2010).
Part of the volume used on-site for wastewater treatment processes re-enters the system. Therefore, the volumes may not be accurate at some plants.
National Water Account 2010
Related links
Water links
