This page provides details about the region, its water resources, land use and water-related infrastructure.
The Sydney region is located on the southeast coast of NSW and covers an area of approximately 30,800 km² (Australian Bureau of Rural Science 2010). It is the most populous metropolitan area in Australia (over 4.6 million in 2009) and is home to 65% of the total NSW population (Australian Bureau of Statistics 2010). It spreads from Shoalhaven Heads in the south to Broken Bay in the north and from Lithgow and Goulburn to the west to the Pacific Ocean on the east coast as shown in Figures P1 and P2.
The Sydney region includes:
The Sydney region excludes the eastern subcatchments of the Hawkesbury-Nepean catchment starting from Mangrove Creek. These sub-catchments were excluded in the NSW draft water sharing plan for greater metropolitan region unregulated river water sources and have little contribution to the Sydney region water sources.
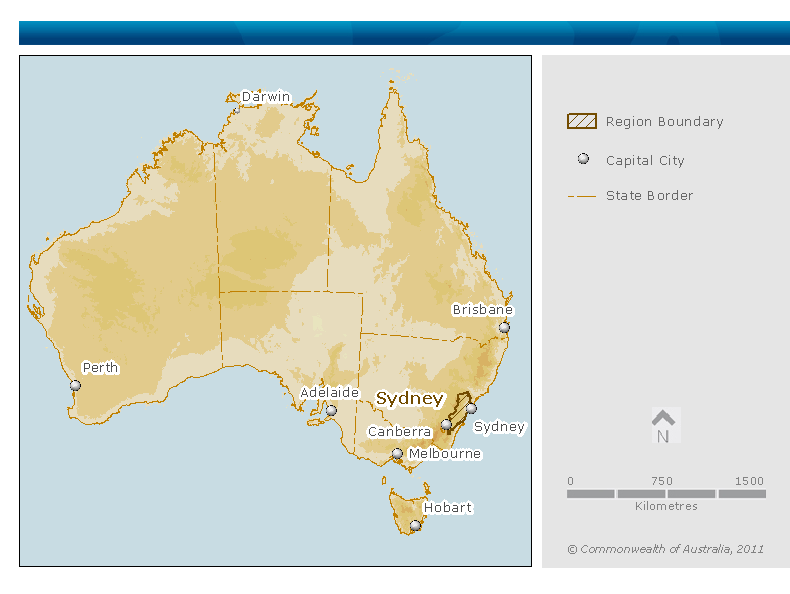
Figure P1. Location map of the Sydney region within Australia
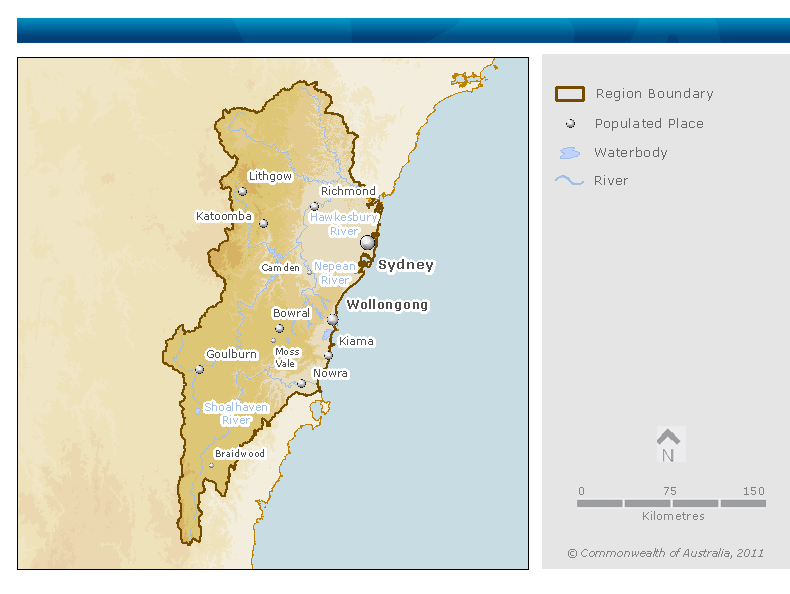
Figure P2. Contextual map of the Sydney region
Catchment area: 22,000 km²
Catchment length: 339 km
At the top of the catchment, the Wollondilly River confluences with the Coxs River at Warragamba Reservoir and flows as the Warragamba River until the Nepean River confluence. The river is named the Hawkesbury River after the confluence with the Gross River. The main tributaries of the Hawkesbury-Nepean River commence in rural areas and national parks. The river is tidal after its confluence with the Colo River.
Catchment area: 7,300 km²
Catchment length: approximately 300 km
The Shoalhaven River commences between the Gourock and Minuma ranges. The upstream catchment primarily contains rural areas and national parks while the downstream reach is an urban area.
The rivers of the Illawarra and metropolitan Sydney are relatively small. The main Illawarra rivers are the Minnamurra River and Macquarie Rivulet. The main metropolitan Sydney Rivers are the Georges, Woronora and Hacking rivers in the south and the Parramatta River in the north.
The upstream reaches of the catchments in the Sydney region are hilly to mountainous country. The most downstream reaches are urbanised coastal areas with tidal rivers. Sydney City lies over Cumberland Plain, which is a relatively flat region to the south and west of the Sydney Harbour, and the Hornsby Plateau which is a sandstone plateau mainly to the north of the harbour. The Hornsby Plateau is dissected by steep valleys.
The Sydney region is physically defined in the General description, and includes the Hawkesbury-Nepean River and Shoalhaven River catchments, rivers of the Illawarra and metropolitan Sydney, and excludes the eastern sub-catchments of the Hawkesbury-Nepean catchment starting from Mangrove Creek.
The region includes all water resources within or beneath the region excluding:
For more information regarding items in this water accounting report, please refer to the significant water accounting policies.
The major population centres with their respective populations for the Sydney region are shown in Table P1.
Table P1. Major population centres for the Sydney region
|
Locality |
Population |
|---|---|
|
Sydney1 |
4,000,000 |
|
Wollongong1 |
289,000 |
|
Nowra1 |
34,000 |
|
Goulburn2 |
20,000 |
Table Notes:
A number of small towns are interspersed throughout the rest of the region including Lithgow, Braidwood and Moss Vale.
The major land use activities in the Sydney region are shown in Table P2 (Australian Bureau of Rural Science 2010). Figure P3 shows the distribution of these land uses.
Table P2. Major land use activities in the Sydney region
|
Land use |
Area (km2) |
Area (%) |
|---|---|---|
|
Conservation and natural environments |
17,125 |
56 |
|
Dryland agriculture |
400 |
1 |
|
Forestry |
1,375 |
4 |
|
Grazing |
7,600 |
25 |
|
Irrigated agriculture |
175 |
<1 |
|
Mining |
75 |
<1 |
|
Other intensive uses |
150 |
<1 |
|
Urban |
3,425 |
11 |
|
Water |
475 |
1 |
|
Total |
30,800 |
100 |
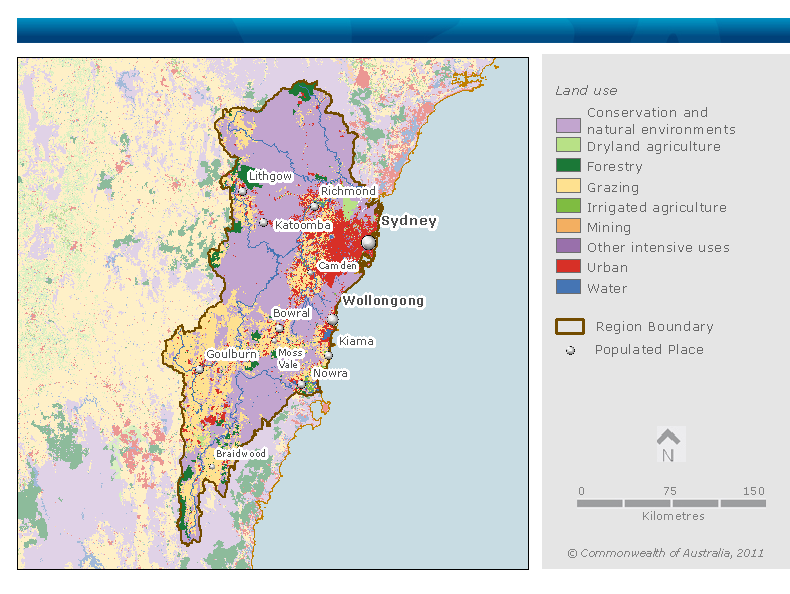
Figure P3. Map of land use in the Sydney region
Land use activities that are major water users in the region are (New South Wales Office of Water 2011b):
Irrigated agriculture occupies less than 1% of land use in the region, and there are no major irrigation districts.
The Sydney region contains the Towra Point Nature Reserve, a Ramsar-listed wetland, on the southern and eastern shores of Botany Bay. It also contains 25 nationally important wetlands, listed in the Directory of important wetlands in Australia.
The Draft water sharing plan for the greater metropolitan region identifies 29 river management zones which were assessed as having high instream values. These were identified according to a number of criteria including the presence of threatened species or ecological communities that are likely to be sensitive to water abstraction.
Several water sources are known to host endangered ecological communities in the Sydney region. The Hawkesbury and Lower Nepean catchment contains Maroota Sands Swamp Forest and Sydney Freshwater Wetlands, both of which are highly sensitive to water abstraction (NSW Office of Water 2011b). Sydney Freshwater Wetlands is the name given to the plant community characterised by the assemblage of specific species restricted to freshwater swamps in swales and depressions on sand dunes and low nutrient sandplain sites in coastal areas (NSW Office of Environment and Heritage 2011). Sydney Freshwater Wetlands also occur in the Illawarra catchment.
The Draft water sharing plan for the greater metropolitan region also identifies high priority groundwater-dependent ecosystems which include wetlands, karst systems and endangered ecological communities. There are 21 karst systems (including the major cave systems of Jenolan, Wombeyan and Bungonia) and five vegetation communities also considered to be groundwater dependent.
|
Reservoir |
Total storage capacity (ML)1 |
Total dead storage (ML) |
Purpose |
|---|---|---|---|
|
Lake Lyell |
34,192 |
2,083 |
Power generation from Mt Piper and Wallerawang power stations |
|
Lake Wallace |
4,004 |
1,798 |
|
|
Thomsons Creek |
27,500 |
0 |
|
|
Pejar |
9,000 |
90 |
Urban water supply to Goulburn Mulwaree Council area |
|
Sooley |
6,250 |
300 |
|
|
Bamarang |
3,800 |
100 |
Urban water supply to the Shoalhaven City Council area |
|
Danjera |
7,800 |
2,300 |
|
|
Cataract |
97,370 |
3,070 |
Urban water supply to Sydney Metropolitan Region |
|
Cordeaux |
93,640 |
0 |
|
|
Avon |
214,400 |
67,700 |
|
|
Nepean |
69,810 |
0 |
|
|
Woronora |
71,790 |
0 |
|
|
Lake Burragorang (Warragamba Reservoir) |
2,031,000 |
4,000 |
|
|
Prospect |
48,200 |
14,900 |
|
|
Wingecarribee |
25,880 |
1,780 |
|
|
Fitzroy Falls |
22,920 |
12,920 |
|
|
Lake Yarrunga (Tallowa Reservoir) |
90,000 |
54,700 |
|
|
Blue Mountains2 |
2,790 |
0 |
|
|
Bundanoon |
1,170 |
Not available |
Urban water supply to Wingecarribee Shire Council area |
|
Medway |
2,046 |
Not available |
|
|
Total3 |
2,863,562 |
Not available |
|
Table Notes:
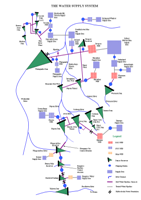
Figure P4. Map of the operating infrastructure and the supply network for Sydney and surrounding areas covering reservoir capacity over 95% in the region (Source: Sydney Catchment Authority, Notations: BOO – Build, Own and Operate, WFP – Water Filtration (Treatment) Plant)
Water from the Shoalhaven catchment can be diverted to the Hawkesbury-Nepean catchment through Lake Yarrunga (Tallowa Dam), Bendeela Pondage and Fitzroy Falls Reservoir.
Water sourced from the supply network shown in Figure P4 is supplied to areas managed by Shoalhaven City Council, Wingecarribee Shire Council and Sydney Water.
Figures P5, P6 and P7 show streamflow pattern, volumes and variation at two major rivers in the region:
Information about climatic conditions for these streamflows is available in Climate overview 2009–10. The two river locations were selected for the following reasons:
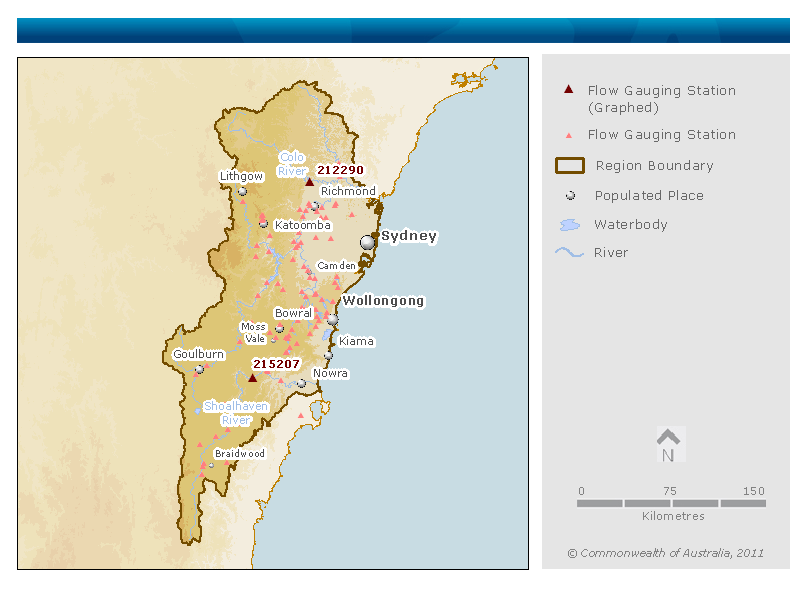
The flow charts for the Colo River exclude 1991–92 because reliable data are not available. The streamflow gauges used to develop these charts are shown in Figure P8.
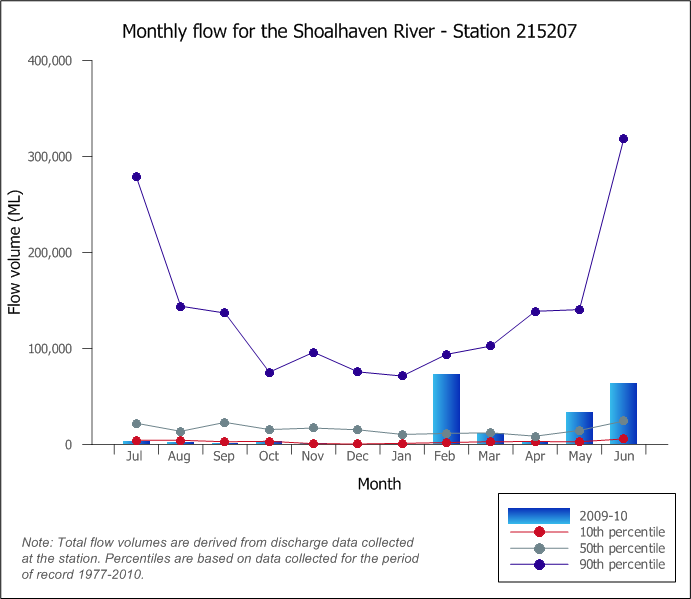
Figure P5. Graph of total monthly flow during 2009–10 compared against period of record percentiles for the Shoalhaven River at Fossickers Flat (Data source: Sydney Catchment Authority)
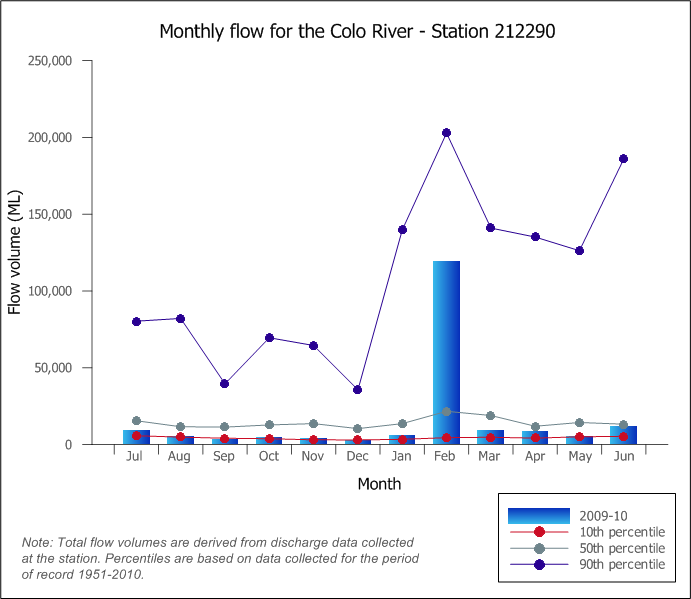
Figure P6. Graph of total monthly flow during 2009–10 compared against period of record percentiles for the Colo River at Upper Colo (Data source: Sydney Catchment Authority)
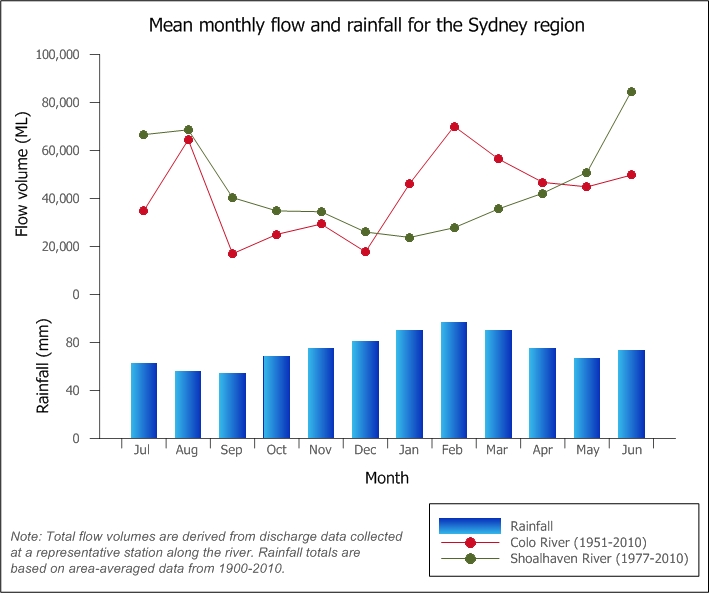
Figure P7. Graph of mean monthly flow and rainfall for the Colo River at Upper Colo (Gauge No. 212290) and the Shoalhaven River at Fossickers Flat (Gauge No. 215207) (Data sources: flow – Sydney Catchment Authority; rainfall – Bureau of Meteorology)
Figures P5 and P6 compare monthly flows for two stations for 2009–10 and different percentage of times. Mean monthly flows shown in Figure P7 are higher than respective 50th percentile flows (Figures P5 and P6) for both stations because flow data for each month are characterised with a small number of very high flows and a large number of low flows.
Figure P8. Map of the streamflow gauging stations used to develop flow charts, other gauging stations managed by Sydney Catchment Authority are also shown (Data source: Sydney Catchment Authority)
There are two inter-valley water transfer systems to and from the Sydney region:
In addition, there are inter-valley water transfers within the Sydney region linking the Shoalhaven catchment, the Hawkesbury-Nepean catchment and Sydney coastal catchments. These transfers are not distinguished in this water account.
The Fish River water supply scheme, which is located outside the Sydney region and managed by the NSW State Water Corporation (State Water), delivers water from Oberon Reservoir and Duckmaloi Weir to:
State Water has a deemed water management licence for the Fish River water supply scheme and operates it in collaboration with the Customer Council. The members of this Customer Council include three organisations operating within the Sydney region:
The volume of water supplied from the Fish River water supply scheme is based on water supply agreements between State Water and its customers.
The three organisations operating within the Sydney region with water entitlements from the Fish River water supply scheme have a Maximum Annual Quantity (MAQ) entitlement as shown in Table P4 (sources: Delta Electricity, Lithgow City Council and Sydney Catchment Authority).
Table P4. Organisations operating within the Sydney region with water entitlements from the Fish River water supply scheme
|
Organisation |
Maximum annual quantity (ML) |
|---|---|
|
Delta Electricity |
8,184 |
|
Lithgow City Council |
2,092 |
|
Sydney Catchment Authority |
3,650 |
Each organisation’s MAQ is available for extraction in a given year if there are no restrictions. When the storage volume of Oberon Reservoir falls below 50%, the water allocation for major consumers is determined based on a restriction table. Restrictions vary with the storage level. In general, entitlement holders are allowed to carryover their unused allocation up to a maximum of 50% of the maximum annual quantity. The carryover volume is a two-year rolling average computed every six months.
The Shoalhaven City Council releases treated and untreated water from the Shoalhaven catchment to the Clyde River catchment, which is outside the Sydney region. Releases are made through Bamarang and Flat Rock reservoirs, respective water treatment plants and the supply network.
Sydney’s desalination plant at Kurnell commenced delivering water on 28 January 2010 (Sydney Water Corporation 2010c). It will operate at full production capacity when the total reservoir storage level is below 70%, and will continue until the level returns to 80%. The plant can supply 250 ML of water a day or up to 15% of greater Sydney’s current water needs. As part of the plant commissioning process, it will operate continuously for two years until mid-2012 to ensure it meets planned performance and reliability targets. Thereafter, the plant is to be operated in accordance with agreed operating rules.
National Water Account 2010
Related links
Water links