


Border Rivers: Water Accounting Statements
as at 30 June 2024
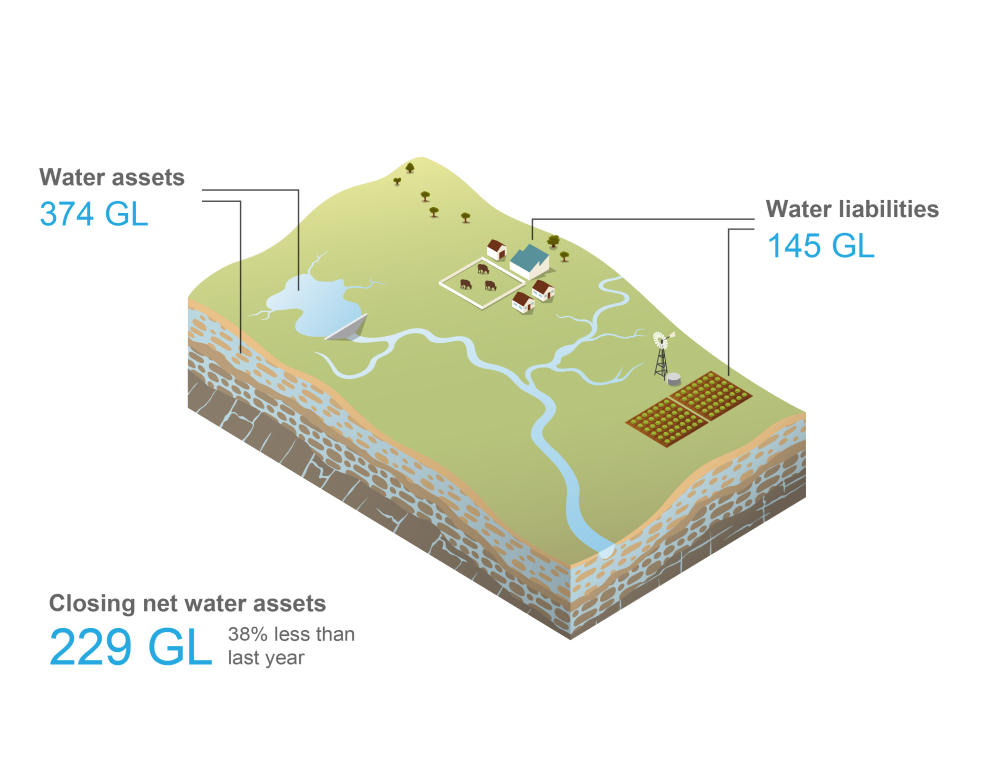
- The volume of water in the catchment's surface water storages decreased during 2023–24.
- Closing net water assets, which is the volume of water assets minus the water liabilities, decreased by 38% compared to last year.
To view the water accounting statements for the Border Rivers catchment scroll down this page or click on the links below:
Statement of Water Assets and Water Liabilities
")
The Statement of Water Assets and Water Liabilities is provided in the table below. The statement presents the volume of water assets, and water liabilities at the start and end of the reporting year.
Select comparative year
| 2024 ML | 2023 ML | 2022 ML | 2021 ML | 2020 ML | 2019 ML | |
|---|---|---|---|---|---|---|
| Water assets | ||||||
| Surface water | 364,871 | 581,727 | 664,314 | 428,051 | 98,503 | 45,865 |
| Accessible storage | 360,250 | 575,425 | 633,473 | 391,685 | 93,652 | 43,652 |
| Dead storage | 2,065 | 2,065 | 2,065 | 2,065 | 2,065 | 2,065 |
| Rivers | 2,556 | 4,237 | 28,776 | 34,301 | 3,148 | 148 |
| Groundwater | 8,810 | 8,810 | 8,810 | 8,810 | 8,810 | 8,810 |
| Sustainable diversion limit | 8,810 | 8,810 | 8,810 | 8,810 | 8,810 | 8,810 |
| Total water assets | 373,681 | 590,537 | 673,124 | 436,861 | 107,313 | 54,675 |
| Water liabilities | ||||||
| Surface water liability | 145,007 | 218,900 | 273,504 | 128,462 | 6,934 | 5,927 |
| Carryover for individual users | 128,823 | 202,684 | 257,292 | 121,815 | 4,770 | 3,736 |
| Carryover environmental purposes | 16,184 | 16,216 | 16,212 | 6,647 | 2,164 | 2,191 |
| Groundwater liability | 0 | 0 | 0 | 0 | 0 | (39) |
| Carryover for individual users | 0 | 0 | 0 | 0 | 0 | (39) |
| Carryover environmental purposes | 0 | 0 | 0 | 0 | 0 | 0 |
| Total water liabilities | 145,007 | 218,900 | 273,504 | 128,462 | 6,934 | 5,888 |
| Net water assets | ||||||
| Net surface water assets | 219,864 | 362,827 | 390,810 | 299,589 | 91,569 | 39,938 |
| Opening net surface water assets | 362,827 | 390,810 | 299,589 | 91,569 | 39,938 | 195,328 |
| Change in net surface water assets | (142,963) | (27,983) | 91,221 | 208,020 | 51,631 | (155,390) |
| Closing net surface water assets | 219,864 | 362,827 | 390,810 | 299,589 | 91,569 | 39,938 |
| Net groundwater assets | 8,810 | 8,810 | 8,810 | 8,810 | 8,810 | 8,849 |
| Opening net groundwater assets | 8,810 | 8,810 | 8,810 | 8,810 | 8,849 | 8,810 |
| Change in net groundwater assets | 0 | 0 | 0 | 0 | (39) | 39 |
| Closing net groundwater assets | 8,810 | 8,810 | 8,810 | 8,810 | 8,810 | 8,849 |
| Total closing net water assets | 228,674 | 371,637 | 399,620 | 308,399 | 100,379 | 48,787 |
| Total change in net water assets | (142,963) | (27,983) | 91,221 | 208,020 | 51,592 | (155,351) |
** different to published volume in historical accounts (see Governance for more information)
Note: quantification approaches used to derive each item volume are provided in the Methods
Statement of Changes in Water Assets and Water Liabilities
")
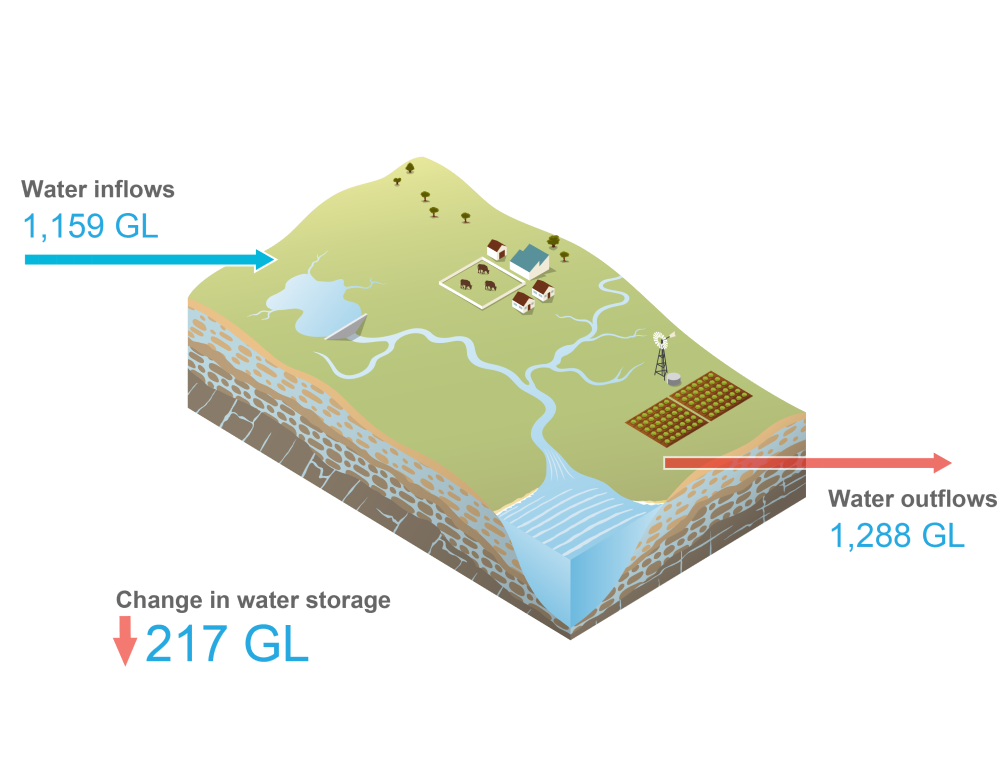
The Statement of Changes in Water Assets and Water Liabilities is provided in the table below. The statement presents the actual water flows associated with the region's water stores, as well as the changes in water storages and water liabilities that occurred during the year.
Select comparative year
| 2024 ML | 2023 ML | 2022 ML | 2021 ML | 2020 ML | 2019 ML | |
|---|---|---|---|---|---|---|
| Water inflows | ||||||
| Surface water inflows | 959,343 | 1,996,550 | 3,479,421 | 1,625,239 | 321,599 | 260,305 |
| Precipitation on storages | 21,517 | 30,166 | 41,869 | 15,338 | 7,182 | 8,834 |
| Precipitation on rivers | 28,172 | 40,244 | 61,783 | 33,014 | 13,088 | 11,406 |
| Runoff | 903,602 | 1,896,201 | 3,330,652 | 1,564,676 | 301,085 | 239,824 |
| Flood return | 6,052 | 29,939 | 45,117 | 12,211 | 244 | 241 |
| Groundwater inflows | 199,709 | 387,362 | 578,396 | 206,001 | 90,930 | 130,302 |
| Inter-region inflow | - | - | - | - | - | - |
| Recharge from surface water* | 199,709 | 387,362 | 578,396 | 206,001 | 90,930 | 130,302 |
| Other groundwater increases | - | - | - | - | - | - |
| Total water inflows | 1,159,052 | 2,383,912 | 4,057,817 | 1,831,240 | 412,529 | 390,607 |
| Water outflows | ||||||
| Surface water outflows | 1,282,382 | 3,000,029 | 5,926,400 | 1,749,135 | 480,217 | 599,138 |
| Evaporation from storages | 58,512 | 61,151 | 61,485 | 28,537 | 26,900 | 37,174 |
| Evaporation from rivers | 46,986 | 68,455 | 92,291 | 40,693 | 25,253 | 38,693 |
| Outflow from the region | 482,232 | 1,925,574 | 4,136,806 | 711,903 | 164,629 | 130,426 |
| Recharge to groundwater* | 199,709 | 387,362 | 578,396 | 206,001 | 90,930 | 130,302 |
| Overbank flow | 38,525 | 291,465 | 569,297 | 101,894 | 22,132 | 317 |
| Diversion: basic rights | 13,474 | 13,474 | 12,097 | 12,097 | 12,097 | 13,474 |
| Floodplain harvesting | 74,795 | 45,587 | 208,249 | 353,693 | 17,849 | 2,950 |
| Non-allocated diversion: individual users | 152,954 | 68,851 | 195,262 | 252,007 | 111,266 | 25,519 |
| Non-allocated diversions: urban system | 664 | 666 | 531 | 168 | 360 | 833 |
| Non-allocated diversions: environmental purposes | 6,390 | 10,634 | 19,955 | 14,670 | 3,246 | 0 |
| Allocated diversion: individual users | 205,893 | 124,488 | 50,071 | 24,076 | 3,659 | 211,556 |
| Allocated diversion: urban system | 2,248 | 2,322 | 1,960 | 2,500 | 1,896 | 494 |
| Allocated diversion: environmental purposes | 0 | 0 | 0 | 896 | 0 | 7,400 |
| Groundwater outflows | 5,326 | 4,440 | 1,968 | 6,444 | 8,237 | 9,148 |
| Inter-region outflow | - | - | - | - | - | - |
| Extraction: basic rights | 375 | 375 | 375 | 375 | 375 | 377 |
| Allocated extraction: individual users | 4,930 | 4,030 | 1,570 | 6,037 | 7,833 | 8,728 |
| Allocated extractions: urban system | 21 | 35 | 23 | 32 | 29 | 43 |
| Allocated extractions: environmental purposes | 0 | 0 | 0 | 0 | 0 | 0 |
| Other groundwater decreases | 0 | 0 | 0 | 0 | 0 | 0 |
| Total water outflows | 1,287,708 | 3,004,469 | 5,928,368 | 1,755,579 | 488,454 | 608,286 |
| Unaccounted-for difference | (88,200) | 537,970 | 2,106,814 | 253,887 | 128,563 | (72,253) |
| Change in water storage | (216,856) | (82,587) | 236,263 | 329,548 | 52,638 | (289,932) |
| Change in surface water storage | (216,856) | (82,587) | 236,263 | 329,548 | 52,638 | (289,932) |
| Change in groundwater storage | 0 | 0 | 0 | 0 | 0 | 0 |
| Total change in water storage | (216,856) | (82,587) | 236,263 | 329,548 | 52,638 | (289,932) |
| Closing water storage | 373,681 | 590,537 | 673,124 | 436,861 | 107,313 | 54,675 |
| Change in water liability | ||||||
| Surface water liability | (73,893) | (54,604) | 145,042 | 121,528 | 1,007 | (134,542) |
| Carryover for individual users | (73,861) | (54,608) | 135,427 | 117,045 | 1,034 | (135,791) |
| Carryover for environmental purposes | (32) | 4 | 9,565 | 4,483 | (27) | 1,249 |
| Groundwater liability | 0 | 0 | 0 | 0 | 39 | (39) |
| Carryover for individual users | 0 | 0 | 0 | 0 | 39 | (39) |
| Carryover for environmental purposes | 0 | 0 | 0 | 0 | 0 | 0 |
| Total change in water liability | (73,893) | (54,604) | 145,042 | 121,528 | 1,046 | (134,581) |
| Net change in water assets | (142,963) | (27,983) | 91,221 | 208,020 | 51,592 | (155,351) |
* between-store flows
** different to published volume in historical accounts (see Governance for more information)
Note: quantification approaches used to derive each item volume are provided in the Methods