


Murray–Darling Basin: Key findings
For the water account period 1 July 2023–30 June 2024
- Total annual rainfall was close to average, following three years of above average rainfall.
- The total Basin storage level decreased by 16% to 79% full at the end of the year.
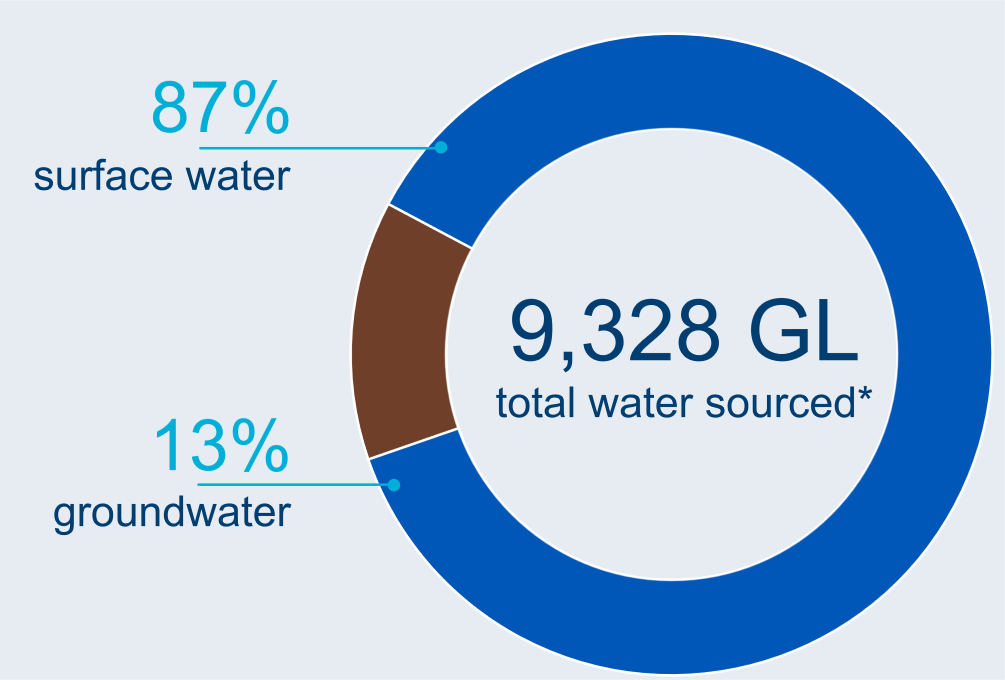
- Water taken from surface water and groundwater resources for consumptive use was 9,328 GL, 40% more than the previous year.
Climate and water
Rainfall

478 mm
close to the Basin average
Streamflow

above average
except in the north-east and south
Storage

79% full

16% less than last year
Water use
Water sourced
Water taken
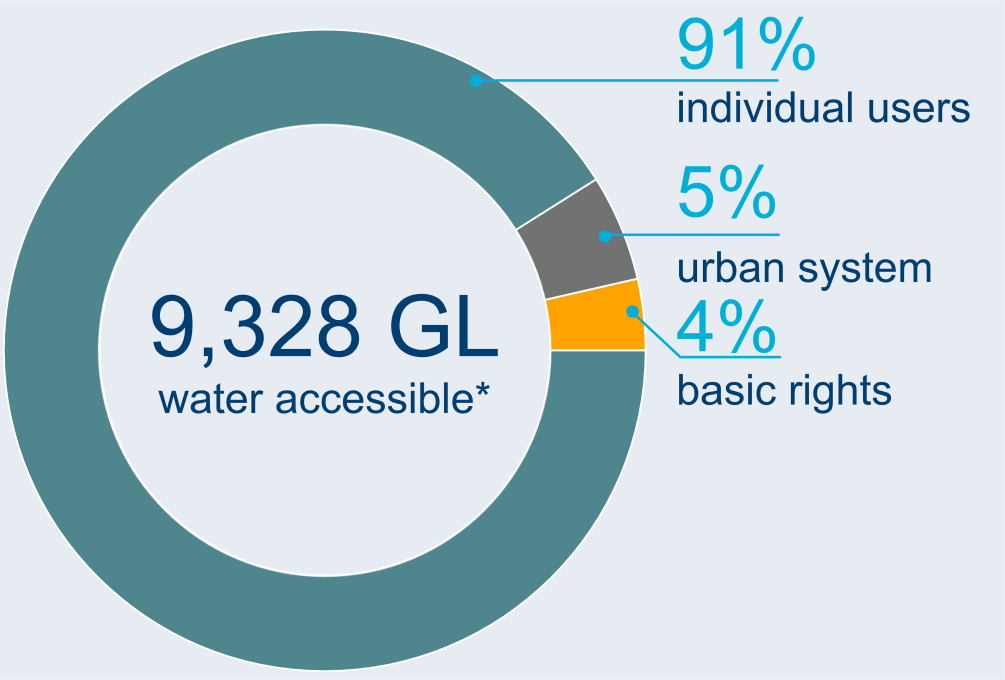
* water taken for consumptive use
Water status
Allocations
12,455 GL
total surface water and groundwater allocations
Water availability
39,048 GL
surface water available in 2023–24
Close to average