


Murray–Darling Basin: Supporting information
For the water account period 01 July 2023 – 30 June 2024
- Total rainfall was close to average following three years of above average rainfall.
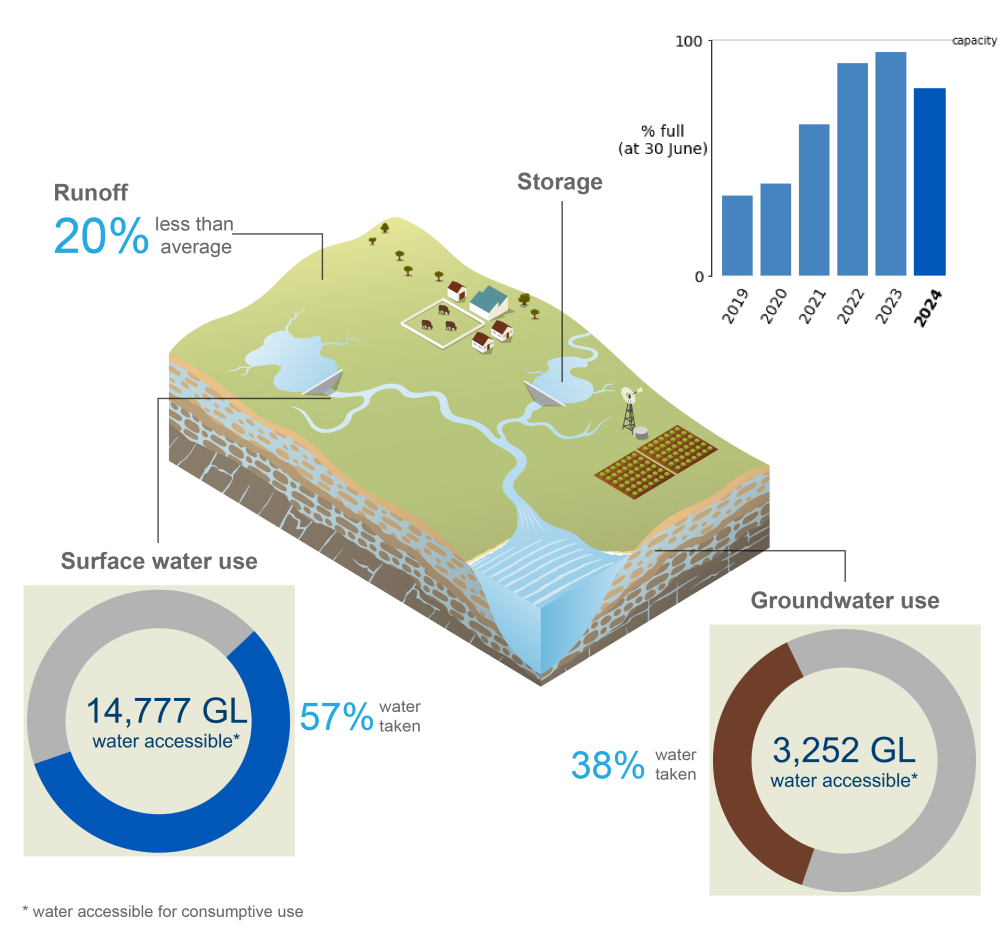
- Annual runoff was around 20% below average.
- End of year storage decreased for the first time in four years to 79% full at 30 June 2024.
- Approximately 57% of the surface water accessible for consumptive use was taken, mainly for irrigation and agricultural purposes.
For further information on the region's water accounting statements scroll down this page or click on the links below:
Water assets
")
- Water asset volumes in the region were 23,901 GL at 30 June 2024, with surface water assets accounting for 85% of this volume.
- The remaining 15% of the region's total water assets are held in aquifers.
Storages
| Surface water | 2024 | 2023 | 2022 | 2021 | 2020 | 2019 |
| Northern Basin | 3,116,869 | 4,298,238 | 4,459,086 | 2,532,584 | 821,148 | 405,581 |
| Southern Basin | 12,663,365 | 14,637,004 | 13,628,557 | 10,226,386 | 6,804,651 | 6,183,152 |
| Accessible total | 15,780,234 | 18,935,242 | 18,087,643 | 12,758,970 | 7,625,799 | 6,558,733 |
| Dead storage | 302,271 | 302,271 | 302,271 | 302,271 | 302,271 | 302,271 |
| Total storage | 16,082,505 | 19,237,513 | 18,389,914 | 13,061,241 | 7,928,070 | 6,891,004 |
| Total capacity | 20,277,416 | 20,339,796 | 20,339,796 | 20,339,796 | 20,339,796 | 20,339,796 |
| % full | 79.3% | 94.6% | 90.4% | 64.2% | 39.0% | 33.9% |
- Storage volumes decreased to 79.3% full at 30 June 2024, from 94.6% full at the same time last year.
- This was the first decrease in end of year storage volume in four years.
- Storages in the southern Basin account for over three quarters of the total Basin capacity (15,569 GL compared with 4,708 GL in the northern Basin).
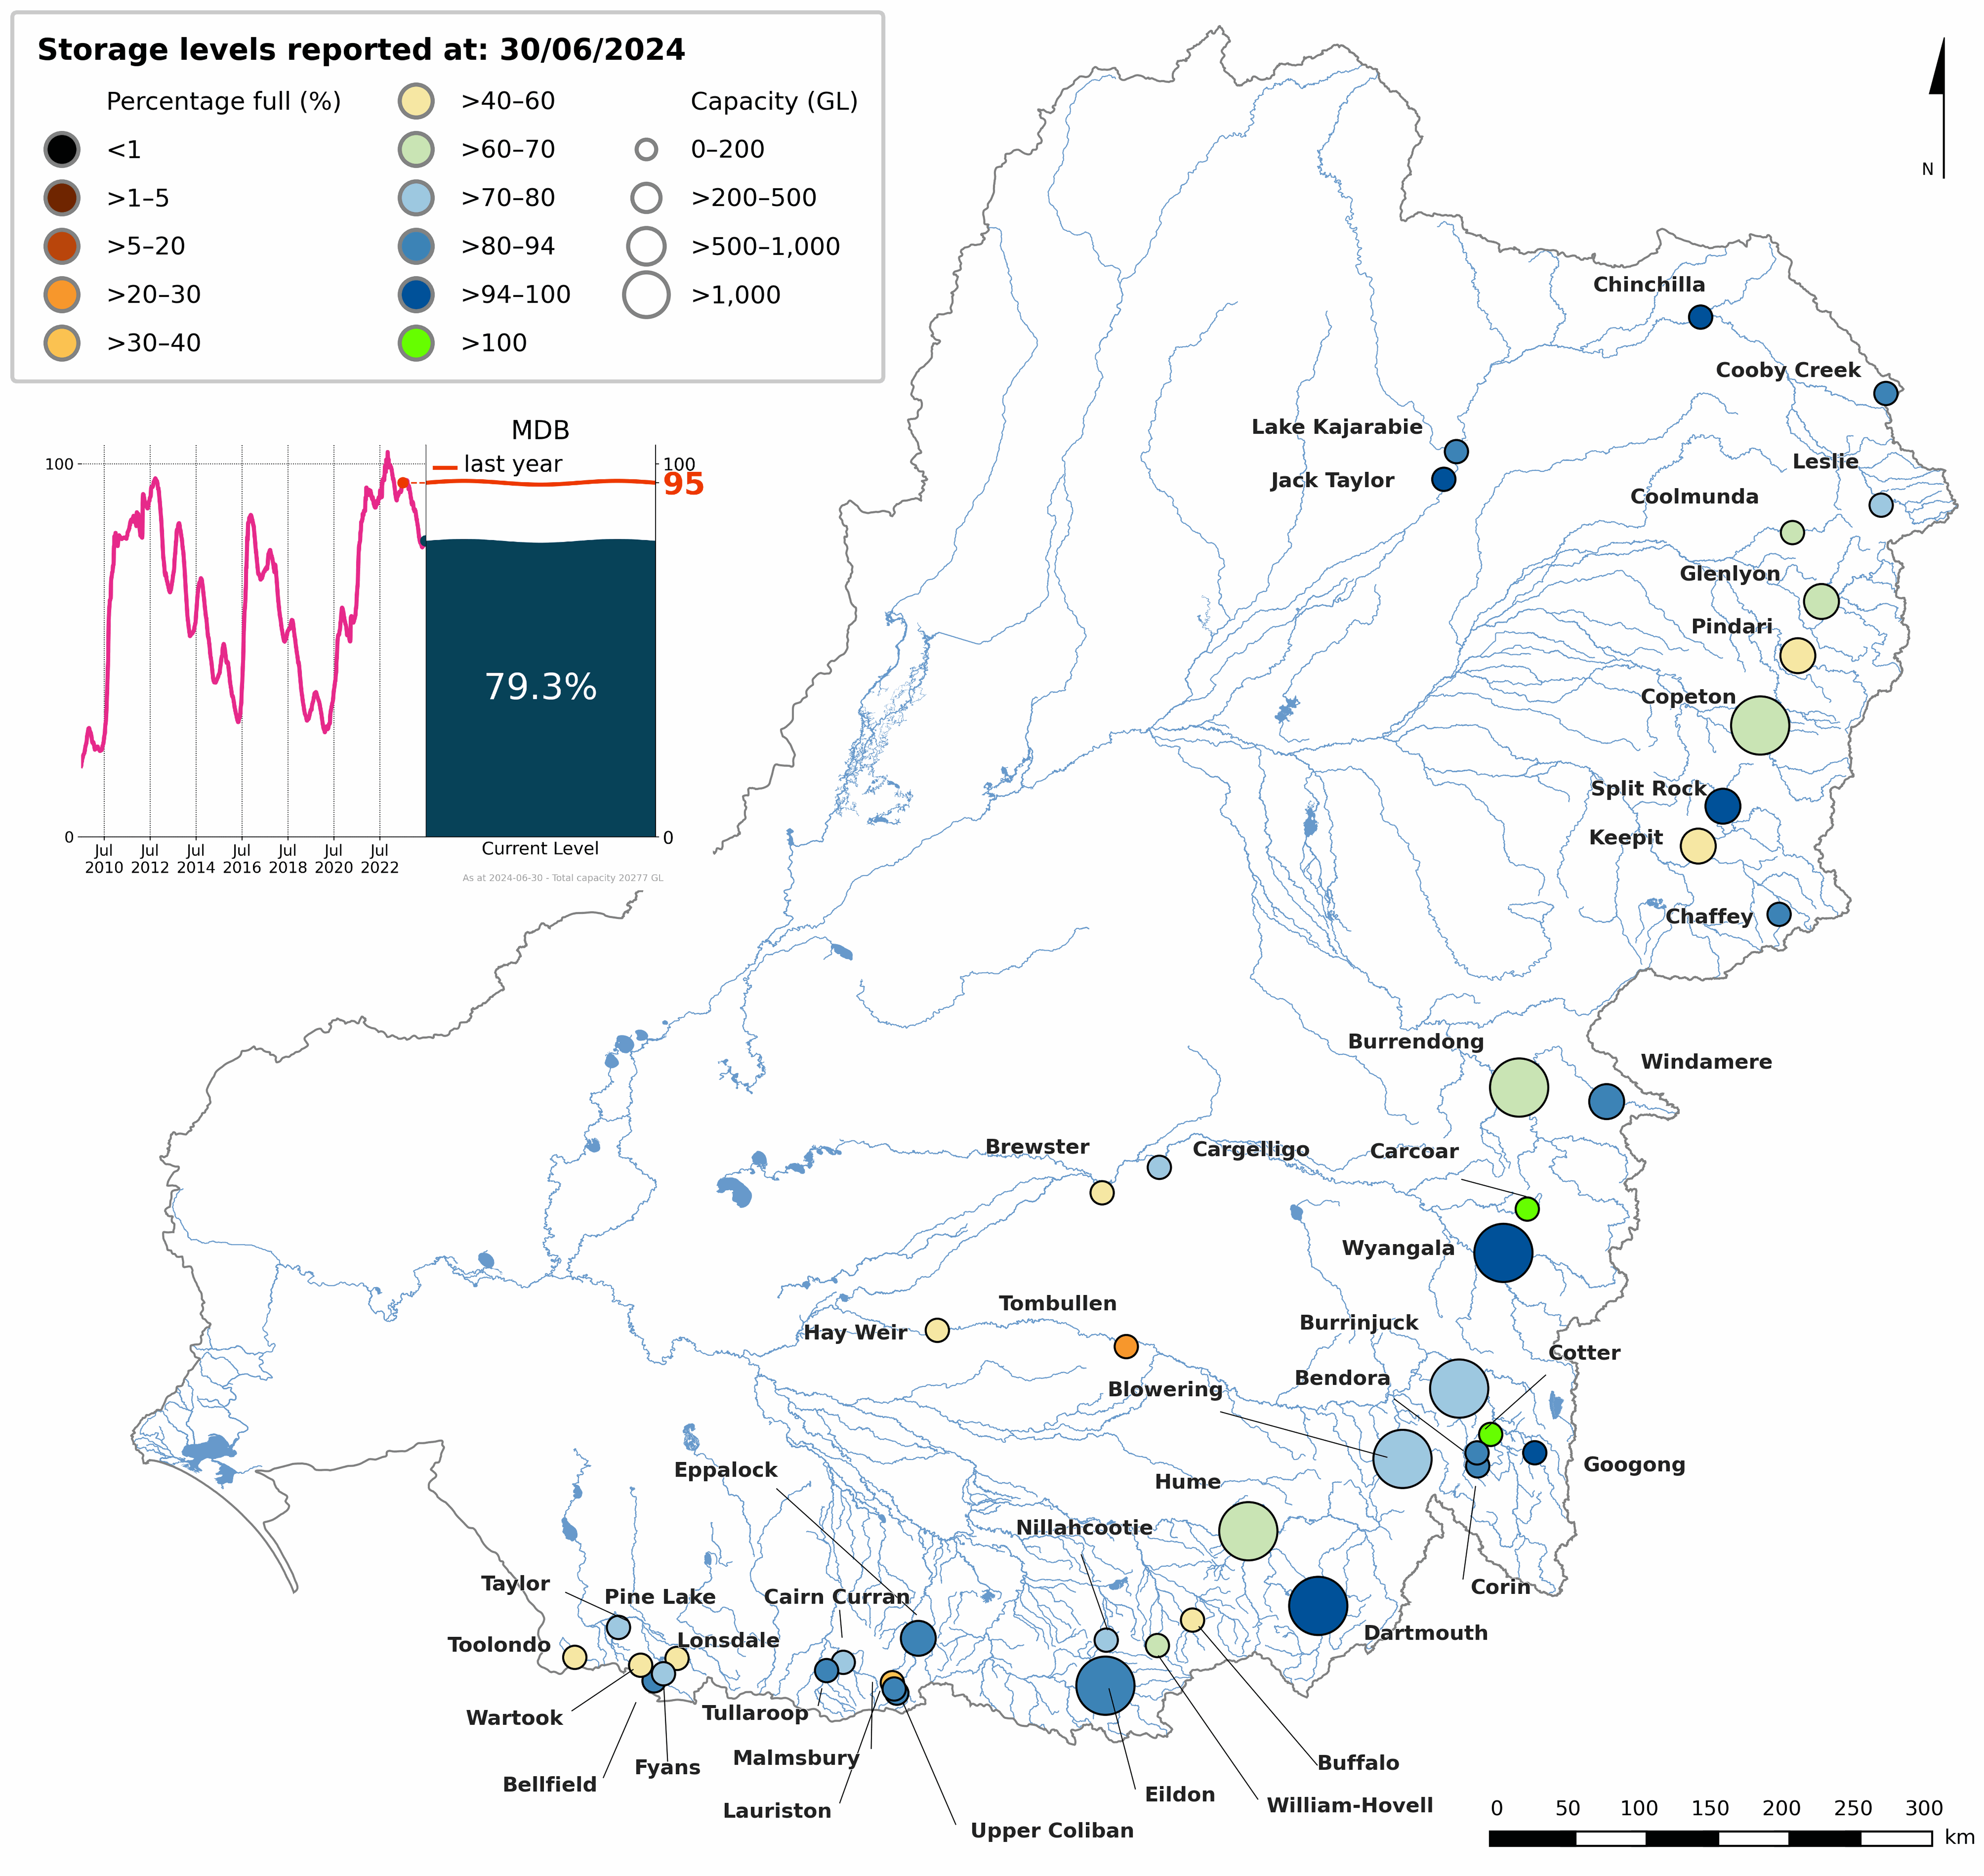
Figure S1 Percentage full volume on 30 June 2024 for each
storage and total storage volume from 2010–2024 (inset)
- At the beginning of the 2023–24 year, storages were 91% full in the northern Basin and 94% full in the southern Basin, following three years of high inflows.
- Despite drier conditions in late winter and early spring, storage volumes remained high in the southern Basin. The three largest storages, Dartmouth Dam, Eildon Dam and Hume Dam were at 98%, 96% and 94% of total capacity on 30 September.
- Heavy rainfall in south-east Australia in early October increased inflows into many southern dams and caused the volume in Eildon Dam to increase rapidly by 5% over three days, resulting in spillway releases to manage water levels.
- Over the drier February to April period, the combined southern Basin storage volume decreased by around 6% to just under 80% full (the lowest level since July 2021), before increasing to 81% at the end of June.
- Storage volume in the northern Basin decreased by 13% over the spring and, despite above average rainfall, continued to decline a further 13% to 65% of total capacity over the summer months when consumptive demand is typically high.
- The combined northern Basin storage volume gradually increased over the April to June period to 66% of total capacity by the end of June 2024.
- More detailed information on the individual storages within the region are available on our Water Storage website.
Groundwater assets
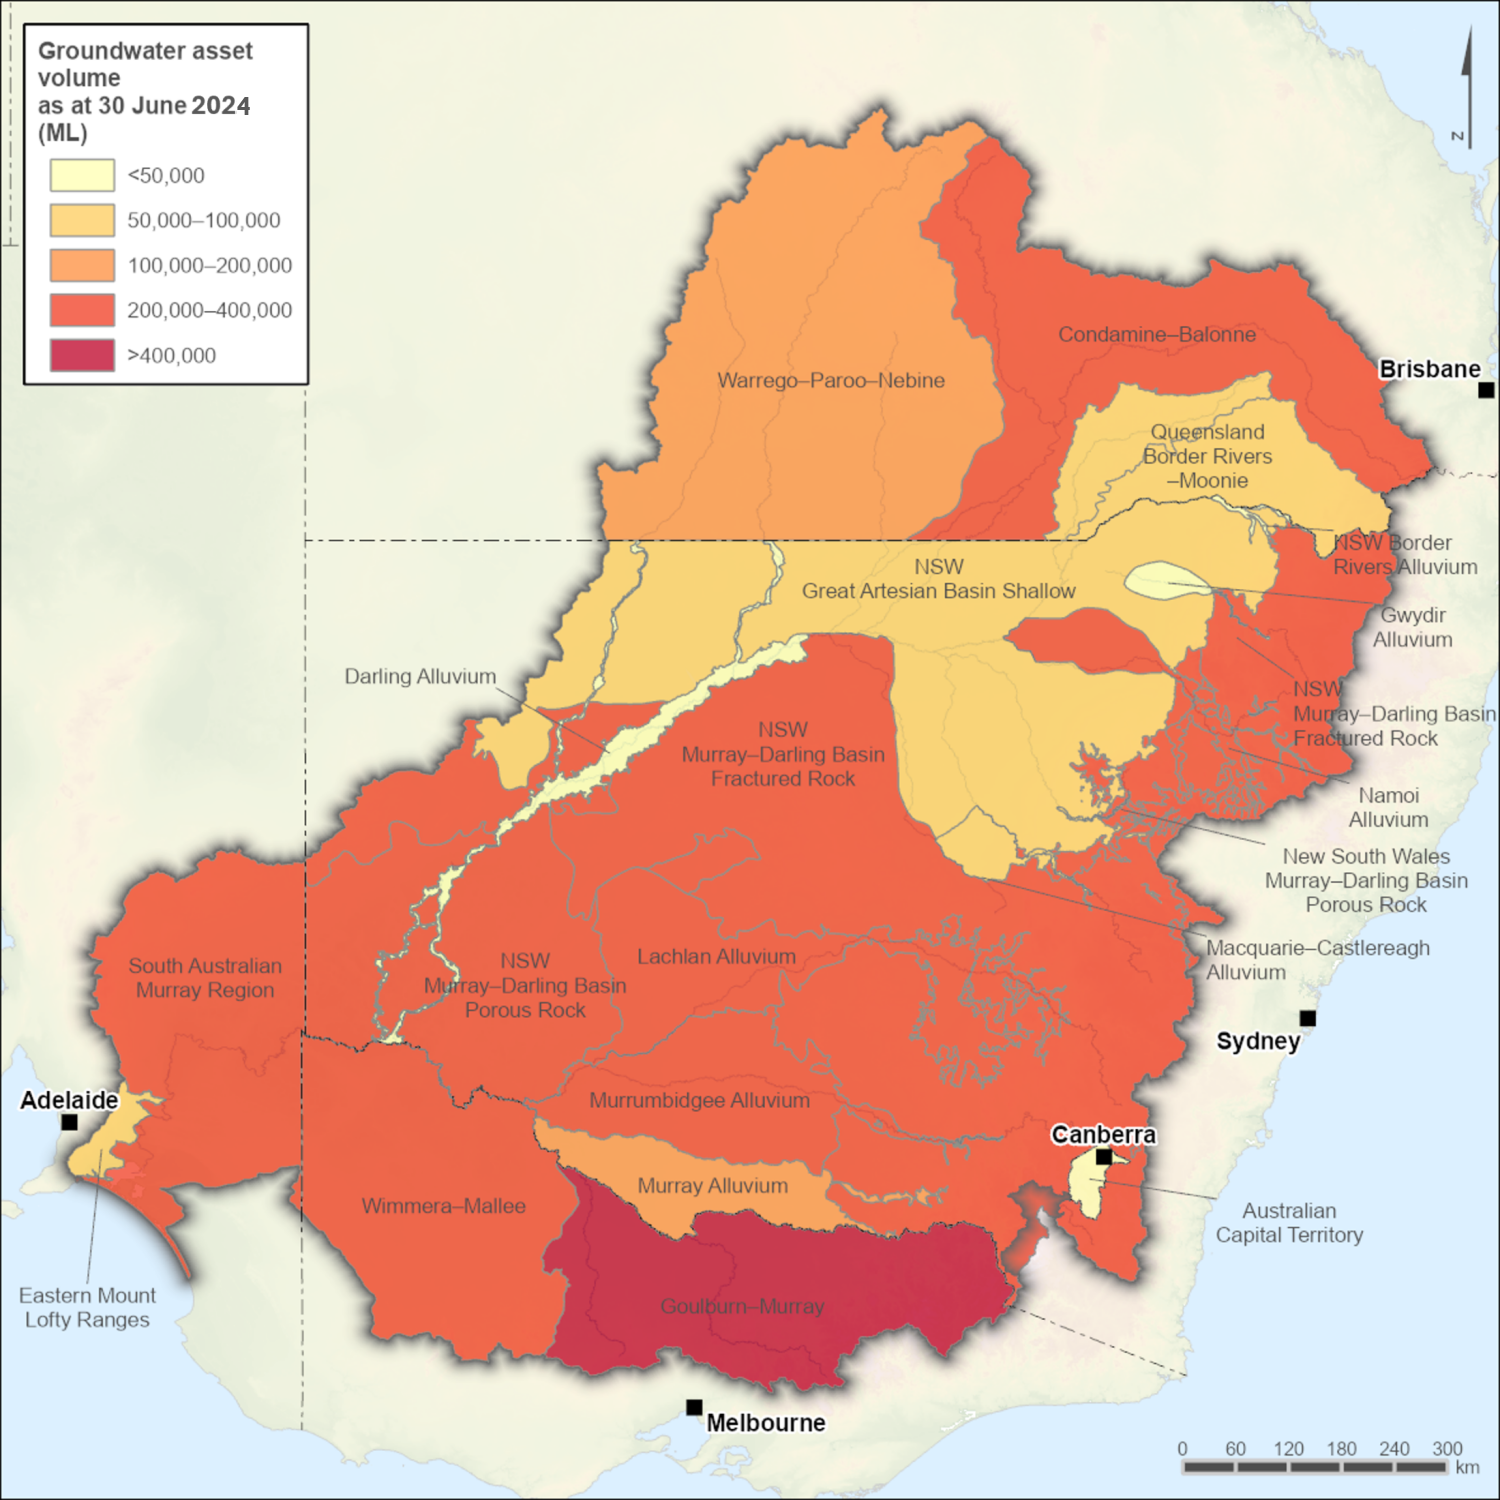
Figure S2 Groundwater sustainable diversion limits in the
Murray–Darling Basin region
- The groundwater asset volume for the region represents sustainable diversion limit volumes as set out in the Murray–Darling Basin Plan.
- The groundwater asset volume at the end of the year was the same as the previous year, reflecting no change to the region's sustainable diversion limits.
Water liabilities
")
- Water liabilities in the Murray–Darling Basin region refer to the volume of allocation remaining on licence entitlements at the end of 2023–24.
| Description | Individual users (ML) | Urban system (ML) | Environmental purposes (ML) | |
| Opening balance at 01 July 2023 | 5,593,148 | 0 | 1,592,627 | |
| add | Surface water allocation | 6,767,821 | 677,488 | 2,755,772 |
| add | Net trade | 47,709 | 3,085 | 752,048 |
| less | Allocated diversion | 6,239,465 | 459,293 | 2,927,261 |
| less | Adjustment for surface water allocation | 1,353,067 | 221,280 | 848,996 |
| Closing balance at 30 June 2024 | 4,816,146 | 0 | 1,324,190 | |
| Description | Individual users (ML) | Urban system (ML) | Salinity and water table management (ML) | Environmental purposes (ML) | |
| Opening balance at 01 July 2023 | 844,743 | 0 | 0 | 0 | |
| add | Allocation | 2,083,291 | 82,530 | 39,031 | 48,680 |
| add | Net trade | (438) | 0 | 0 | 0 |
| less | Allocated extraction | 940,812 | 32,312 | 11,417 | 40,224 |
| less | Adjustment for groundwater allocation | 1,142,041 | 50,218 | 27,614 | 8,456 |
| Closing balance at 30 June 2024 | 844,743 | 0 | 0 | 0 | |
- Water supply licences for individual users and environmental purposes include carryover provisions, which means a portion of water allocation that has not been abstracted at the end of the water year can be carried over into the next water year.
- For urban system supply and salinity and water table management licences, there are no carryover provisions. The portion of water allocation that has not been abstracted at the end of a water year is forfeited, meaning the allocation remaining at the end of the year is 0 ML.
- The total carryover volume at the start of 2023–24 was the highest since 2012–13, following three years of increasing water availability.
- Surface water allocations remained high but were lower than the previous two years.
- Total surface water allocation for individual, urban, and environmental purposes in 2023–24 was 10,201 GL, with individual users, mostly irrigated agriculture, making up 66% of this volume.
- Total surface water and groundwater liabilities closed lower in 2023–24 than in 2022–23.
Water flows
")
- Water inflows into the Murray-Darling Basin region were approximately 36,723 GL, 55% less than last year and 20% less that the 2011–2023 average.
- Surface water inflows contributed 21,974 GL (60%) of total water inflows, with runoff accounting for 84% of the total surface water inflows.
- Runoff was 20% below average (based on modelled data from 1975 to 2023) after three years of above average runoff.
- Total water outflows from the Murray-Darling Basin region were 38,339 GL, 46% less than last year but close to the 2011–2023 average.
- While outflows due to consumptive use increased, outflows associated with the high rainfall events (recharge to groundwater, overbank flows and outflow to sea) were lower than in the previous two years.
- Surface water outflows accounted for 97% of total outflows.
- Groundwater outflows were higher than in the previous two years due to an increase in consumptive use.
- A more detailed breakdown of inflows and outflows is given in the Statement of Changes in Water Assets and Water Liabilities.
Water availability
| 2024 | 2023 | 2022 | 2021 | 2020 | 2019 | |
| Water availability* | 39,048,178 | 61,421,731 | 51,460,784 | 32,166,573 | 22,282,613 | 20,528,796 |
| Water accessible** | 14,776,929 | 16,133,698 | 16,526,385 | 12,499,065 | 6,945,841 | 7,037,105 |
| Water taken*** | 8,386,436 | 6,350,243 | 8,573,349 | 8,148,554 | 5,315,319 | 5,841,944 |
| % water accessible taken | 57% | 39% | 52% | 65% | 77% | 83% |
* Surface water availability is sum of accessible storage at the start of the year (see Water assets) and estimated inflows into storages and rivers during the year.
** Accessible water is the volume of water that is accessible for consumptive use and is the sum of surface water allocations, other statutory rights and carryover at the start of the water year.
*** Water taken is the volume of water for taken for consumptive
use and includes floodplain harvesting. This does not include water
for environmental purposes.
- Volumes of water accessible for use and water taken are both influenced by water availability.
- Water availability in 2023–24 was close to average (based on all available data from 2011 to 2023). While storage volumes at the beginning of the year were the highest since 2010–11, runoff was below average and much less than the previous two years.
- Water accessible for take was slightly less than last year but 20% above average (based on all available data from 2011 to 2023), with increased water availability allowing for high carryover and announced allocations at the beginning of the water year.
- Water taken from surface water resources was the highest since 2017–2018, which may reflect high accessible water but a return to drier conditions in some areas.
- Surface water taken for consumptive use in 2023–24 was 57% of the water accessible, close to 10% less than the 2011–2023 average.
Water use
")
- Total consumptive use for individual users, urban systems, and basic rights was 9,328 GL in 2023–24, 87% sourced from surface water resources and the remaining 13% from groundwater resources.
| Surface water | 2024 | 2023 | 2022 | 2021 | 2020 |
|---|---|---|---|---|---|
| Queensland | |||||
| Individual users | 701,645 | 340,753 | 1,000,612 | 528,620 | 588,255 |
| Urban system | 7,768 | 7,480 | 6,597 | 7,564 | 7,984 |
| Environmental purposes | 99,333 | 142,870 | 366,365 | 73,911 | 192,719 |
| Basic rights | 10,589 | 10,589 | 10,589 | 10,589 | 10,589 |
| Total | 819,355 | 501,692 | 1,384,163 | 620,684 | 799,547 |
| New South Wales | |||||
| Individual users | 4,549,341 | 3,084,394 | 3,921,287 | 3,592,604 | 1,634,963 |
| Urban system | 91,966 | 82,692 | 77,870 | 79,016 | 89,310 |
| Environmental purposes | 1,140,094 | 920,037 | 1,124,134 | 916,094 | 158,554 |
| Basic rights | 50,263 | 50,263 | 49,279 | 49,279 | 49,252 |
| Total | 5,831,664 | 4,137,386 | 5,172,570 | 4,636,993 | 1,932,079 |
| Victoria | |||||
| Individual users | 1,813,002 | 1,575,975 | 1,933,464 | 1,807,802 | 1,695,319 |
| Urban system | 155,002 | 117,922 | 134,259 | 149,429 | 136,982 |
| Environmental purposes | 858,135 | 622,036 | 884,678 | 608,528 | 840,035 |
| Basic rights | 27,465 | 27,465 | 27,465 | 27,465 | 27,465 |
| Total | 2,853,604 | 2,343,398 | 2,979,866 | 2,593,224 | 2,699,801 |
| South Australia | |||||
| Individual users | 484,690 | 371,523 | 458,754 | 461,274 | 420,762 |
| Urban system | 157,107 | 105,658 | 148,935 | 172,485 | 156,076 |
| Environmental purposes | 1,018,666 | 748,110 | 873,351 | 809,102 | 976,525 |
| Basic rights | 6,062 | 6,062 | 6,062 | 6,062 | 6,062 |
| Total | 1,666,525 | 1,231,353 | 1,487,102 | 1,448,923 | 1,559,425 |
| Australian Capital Territory | |||||
| Individual users | 1,819 | 1,350 | 740 | 1,301 | 945 |
| Urban system | 51,346 | 47,703 | 45,336 | 49,268 | 55,330 |
| Environmental purposes | - | - | - | - | - |
| Basic rights | - | - | - | - | - |
| Total | 53,165 | 49,053 | 46,076 | 50,569 | 56,275 |
| Basin Total | |||||
| Individual users | 7,550,497 | 5,373,995 | 7,314,857 | 6,391,601 | 4,340,244 |
| Urban system | 463,189 | 361,455 | 412,997 | 457,762 | 445,682 |
| Environmental purposes | 3,166,228 | 2,433,053 | 3,248,528 | 2,407,635 | 2,167,833 |
| Basic rights | 94,379 | 94,379 | 93,395 | 93,395 | 93,368 |
| Total | 11,224,293 | 8,262,882 | 11,069,777 | 9,350,393 | 7,047,127 |
- In 2023–24, water taken from surface water resources was 11,224 GL, 23% more than average (based on data from 2011 to 2023), and 36% more than last year.
- Approximately 67% of the total surface water diverted was for consumptive use by individual users, 4% was supplied to the urban system and 1% was for individual users under a basic right.
- The remaining 28% of this volume was used for environmental purposes.
- Across the region, the volume taken by individual users increased in 2023–24, with high carryover and allocations along with drier conditions in some areas contributing to the higher use. In total, 7,550 GL was used compared with 5,374 GL in 2022–23.
- With the exception of Queensland, environmental flows were also higher across the region.
| Surface water | 2024 | 2023 | 2022 | 2021 | 2020 |
|---|---|---|---|---|---|
| Queensland | |||||
| Individual users | 147,983 | 136,633 | 93,661 | 123,513 | 133,005 |
| Urban system | 4,783 | 4,269 | 4,082 | 4,214 | 4,544 |
| Salinity and water table management | - | - | - | - | - |
| Basic rights | 24,446 | 24,450 | 24,450 | 24,450 | 24,446 |
| Total | 177,212 | 165,352 | 122,193 | 152,177 | 161,955 |
| New South Wales | |||||
| Individual users | 649,685 | 319,096 | 334,460 | 559,376 | 978,841 |
| Urban system | 32,531 | 28,043 | 27,965 | 31,830 | 41,777 |
| Salinity and water table management | 1,140 | 1,251 | 4,121 | 5,133 | 1,339 |
| Basic rights | 191,772 | 191,745 | 191,745 | 191,755 | 188,448 |
| Total | 875,128 | 540,135 | 558,291 | 788,094 | 1,210,405 |
| Victoria | |||||
| Individual users | 95,157 | 65,493 | 121,100 | 196,345 | 242,370 |
| Urban system | - | - | - | - | - |
| Salinity and water table management | - | - | - | - | - |
| Basic rights | 20,231 | 20,280 | 20,280 | 20,280 | 20,290 |
| Total | 115,388 | 85,773 | 141,380 | 216,625 | 262,660 |
| South Australia | |||||
| Individual users | 49,146 | 38,977 | 47,443 | 48,379 | 48,539 |
| Urban system | - | - | - | - | - |
| Salinity and water table management | 10,277 | 10,648 | 13,223 | 12,375 | 12,709 |
| Basic rights | 3,924 | 3,924 | 3,924 | 3,924 | 3,924 |
| Total | 63,347 | 53,549 | 64,590 | 64,678 | 65,172 |
| Australian Capital Territory | |||||
| Individual users | 641 | 457 | 316 | 630 | 339 |
| Urban system | - | - | - | - | - |
| Salinity and water table management | - | - | - | - | - |
| Basic rights | - | - | - | - | - |
| Total | 641 | 457 | 316 | 630 | 339 |
| Basin Total | |||||
| Individual users | 942,612 | 560,656 | 596,980 | 928,243 | 1,403,094 |
| Urban system | 37,314 | 32,312 | 32,047 | 36,044 | 46,321 |
| Salinity and water table management | 11,417 | 11,899 | 17,344 | 17,508 | 14,048 |
| Basic rights | 240,373 | 240,399 | 240,399 | 240,409 | 237,108 |
| Total | 1,231,716 | 845,266 | 886,770 | 1,222,204 | 1,700,571 |
- Water taken from groundwater resources was 1,232 GL, 46% more than last year but close to the 2011–2023 average.
- Approximately, 77% of groundwater extractions were for individual users and 20% were for individual users under a basic right.
- Around 3% of the extraction was for the urban system, while less than 1% was extracted for salinity and water table management.
- Groundwater taken for individual users increased across all areas, with a Basin total of 1,232 GL used in 2023–24 compared with 845 GL in 2022–23.
- A return to average rainfall conditions may have increased dependency on groundwater after the previous two years of higher rainfall and surface water availability.