


Murray–Darling Basin: Statement of Changes in Water Assets and Water Liabilities
For the water account period 01 July 2023 – 30 June 2024
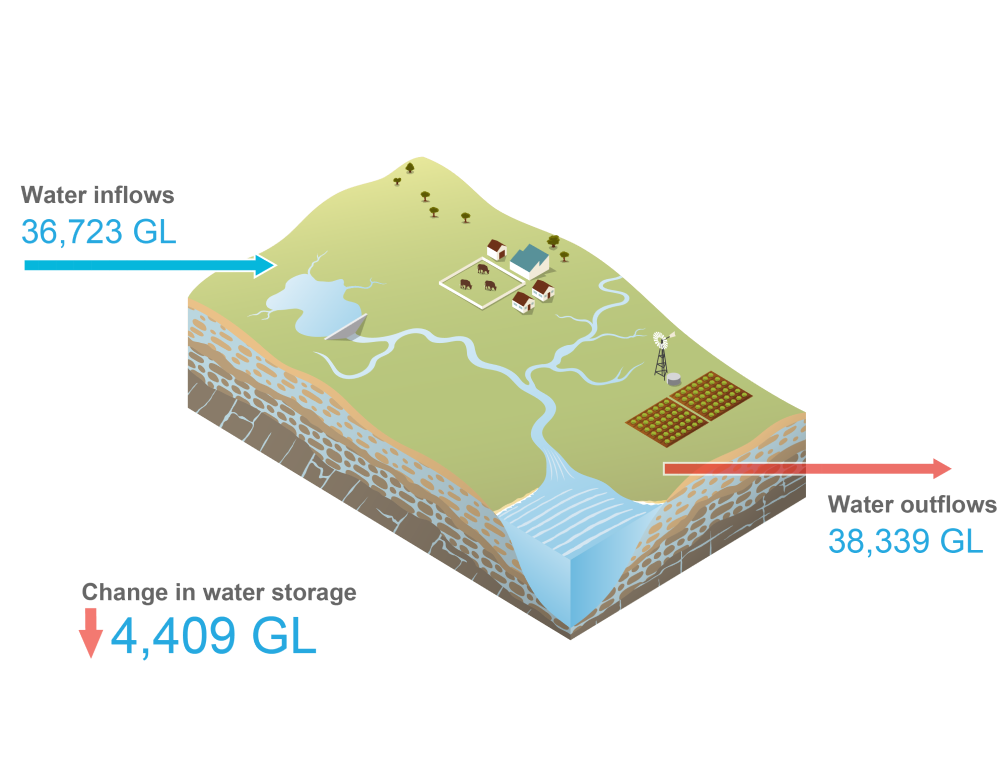
- Surface water Inflows and outflows were close to average.
- The volume of water in the region's combined storages (total inflows minus total outflows) decreased during 2023–2024.
The Statement of Changes in Water Assets and Water Liabilities is provided in the table below.
The statement presents the actual water flows associated with the region's water stores, as well as the changes in water assets and water liabilities that occurred during the year.
Select comparative year
| 2024 ML | 2023 ML | 2022 ML | 2021 ML | 2020 ML | 2019 ML | ||
|---|---|---|---|---|---|---|---|
| Water inflows | |||||||
| Surface water inflows | 21,973,550 | 48,140,078 | 41,615,245 | 25,671,656 | 16,868,776 | 10,795,457 | |
| Precipitation on storages | 1,137,971 | 1,815,451 | 1,559,423 | 1,051,047 | 778,195 | 719,634 | |
| Precipitation on rivers | 454,285 | 1,102,727 | 810,127 | 441,040 | 295,785 | 208,577 | |
| Runoff | 18,520,680 | 40,415,910 | 36,332,264 | 23,048,687 | 14,619,900 | 8,712,006 | |
| Flood return | 1,399,639 | 4,432,763 | 2,338,267 | 840,876 | 724,702 | 657,193 | |
| Return flows | 460,975 | 373,227 | 575,164 | 290,006 | 450,194 | 498,047 | |
| Groundwater inflows | 14,749,334 | 32,963,470 | 24,991,333 | 9,769,088 | 8,029,778 | 7,639,088 | |
| Recharge from surface water* | 14,741,987 | 32,955,204 | 24,984,569 | 9,762,877 | 8,023,232 | 7,632,441 | |
| Inter-region inflow | 2,764 | 3,032 | 2,914 | 2,568 | 2,632 | 2,321 | |
| Inter-region coastal inflow | 39 | 38 | 9 | 67 | 67 | 369 | |
| Return flows | 3407 | 3,651 | 2,811 | 2,755 | 3,302 | 2,938 | |
| Managed aquifer recharge: individual user | 1,137 | 1,545 | 1,030 | 821 | 545 | (41) | |
| Other increases | - | - | - | - | - | 1,060 | |
| Total water inflows | 36,722,884 | 81,103,548 | 66,606,578 | 35,440,744 | 24,898,554 | 18,434,545 | |
| Water outflows | |||||||
| Surface water outflows | 37,063,873 | 70,190,855 | 54,992,102 | 26,487,898 | 20,519,339 | 20,001,188 | |
| Evaporation from storages | 3,308,400 | 3,253,509 | 3,226,601 | 2,412,682 | 2,162,294 | 2,534,590 | |
| Evaporation from rivers | 1,138,644 | 2,189,068 | 1,701,084 | 832,344 | 635,628 | 698,332 | |
| Outflow to the sea | 3,037,267 | 6,867,781 | 4,225,432 | 974,881 | 678,205 | 657,638 | |
| Recharge to groundwater | 14,741,987 | 32,955,204 | 24,984,569 | 9,762,877 | 8,023,232 | 7,632,441 | |
| Overbank flow | 3,334,911 | 16,141,997 | 9,032,539 | 1,948,925 | 1,536,828 | 1,085,533 | |
| Diversions: basic rights | 94,379 | 94,379 | 93,395 | 93,395 | 93,368 | 60,841 | |
| Non-allocated diversion: individual users | 1,311,032 | 753,144 | 1,986,157 | 1,439,697 | 1,106,697 | 392,936 | |
| Non-allocated diversion: urban system | 3,896 | 3,181 | 3,040 | 2,392 | 5,030 | 6,761 | |
| Non-allocated diversion: environmental purposes | 188,967 | 176,563 | 772,983 | 195,632 | 197,302 | 8,741 | |
| Floodplain harvesting | 278,371 | 520,414 | 752,100 | 1,205,796 | 436,025 | 83,374 | |
| Allocated diversion: individual users | 6,239,465 | 4,620,851 | 5,328,700 | 4,951,904 | 3,233,547 | 4,810,129 | |
| Allocated diversion: urban system | 459,293 | 358,274 | 409,957 | 455,370 | 440,652 | 487,903 | |
| Allocated diversion: environmental purposes | 2,927,261 | 2,256,490 | 2,475,545 | 2,212,003 | 1,970,531 | 1,541,969 | |
| Groundwater outflows | 1,274,732 | 887,532 | 928,988 | 1,264,136 | 1,702,178 | 1,917,545 | |
| Inter-region outflow | 28 | 52 | 38 | 57 | 41 | 198 | |
| Inter-region coastal outflow | 2,764 | 1,990 | 1,956 | 1,651 | 1,566 | 1,308 | |
| Extraction: basic rights | 240,373 | 240,399 | 240,399 | 240,409 | 237,108 | 245,146 | |
| Non-allocated extraction | 1,800 | 1,800 | 1,800 | 1,800 | 1,800 | 1,800 | |
| Allocated extraction: individual users | 940,812 | 558,856 | 595,180 | 926,443 | 1,401,294 | 1,586,358 | |
| Allocated extraction: urban system | 37,314 | 32,312 | 32,047 | 36,044 | 46,321 | 52,159 | |
| Allocated extraction: salinity and water table management | 11,417 | 11,899 | 17,344 | 17,508 | 14,048 | 19,538 | |
| Allocated extraction: environmental purposes | 40,224 | 40,224 | 40,224 | 40,224 | - | - | |
| Other groundwater decreases | - | - | - | - | - | 11,038 | |
| Total water outflows | 38,338,605 | 71,078,387 | 55,921,090 | 27,752,034 | 22,221,517 | 21,918,733 | |
| Unaccounted-for difference | (2,793,401) | (11,180,111) | (2,236,044) | (1,815,976) | (523,465) | (1,147,481) | |
| Change in water storage | |||||||
| Change in surface water storage | (4,409,122) | (1,154,950) | 8,449,444 | 5,872,734 | 2,153,572 | (4,621,691) | |
| Change in groundwater storage | 0 | 0 | 0 | 0 | 0 | (9,978) | |
| Total change in water storage | (4,409,122) | (1,154,950) | 8,449,444 | 5,872,734 | 2,153,572 | (4,631,669) | |
| Closing water storage | 23,901,105 | 28,310,227 | 29,465,177 | 21,015,733 | 15,142,999 | 12,989,427 | |
| Change in water liability | |||||||
| Surface water liability | (1,045,439) | 376,755 | 1,712,547 | 2,056,786 | 1,095,056 | (1,192,058) | |
| Carryover for individual users | (777,002) | 294,750 | 1,240,515 | 1,596,304 | 1,314,153 | (1,079,611) | |
| Carryover for urban system | 0 | 0 | 0 | 0 | 0 | 0 | |
| Carryover for environmental purposes | (268,437) | 82,005 | 472,032 | 460,482 | (219,097) | (112,447) | |
| Groundwater liability | 0 | 35,106 | 141,388 | (29,904) | 89,989 | (84,648) | |
| Carryover for individual users | 0 | 35,106 | 141,388 | (29,904) | 89,989 | (84,648) | |
| Carryover for urban system | 0 | 0 | 0 | 0 | 0 | 0 | |
| Carryover for salinity and water table management | 0 | 0 | 0 | 0 | 0 | 0 | |
| Carryover for environmental purposes | 0 | 0 | 0 | 0 | 0 | 0 | |
| Total change in water liability | (1,045,439) | 411,861 | 1,853,935 | 2,026,882 | 1,185,045 | (1,276,706) | |
| Net change in water assets | (3,363,683) | (1,566,811) | 6,595,509 | 3,845,852 | 968,527 | (3,354,963) | |
* between-store flows
Note: Historical inflow and outflow volumes have been impacted by the removal of some modelled groundwater recharge due to this dataset being incomplete.
Note: quantification approaches used to derive each item volume are provided in the Methods