


Murray–Darling Basin: Climate and water
For the water account period 01 July 2023 – 30 June 2024
- Total annual rainfall was close to average, with the above average rainfall in the central and northern Basin and rainfall deficiencies in parts of the south and east.
- Basin averaged September rainfall was the lowest on record, while November and January rainfall totals were above the 90th percentile.
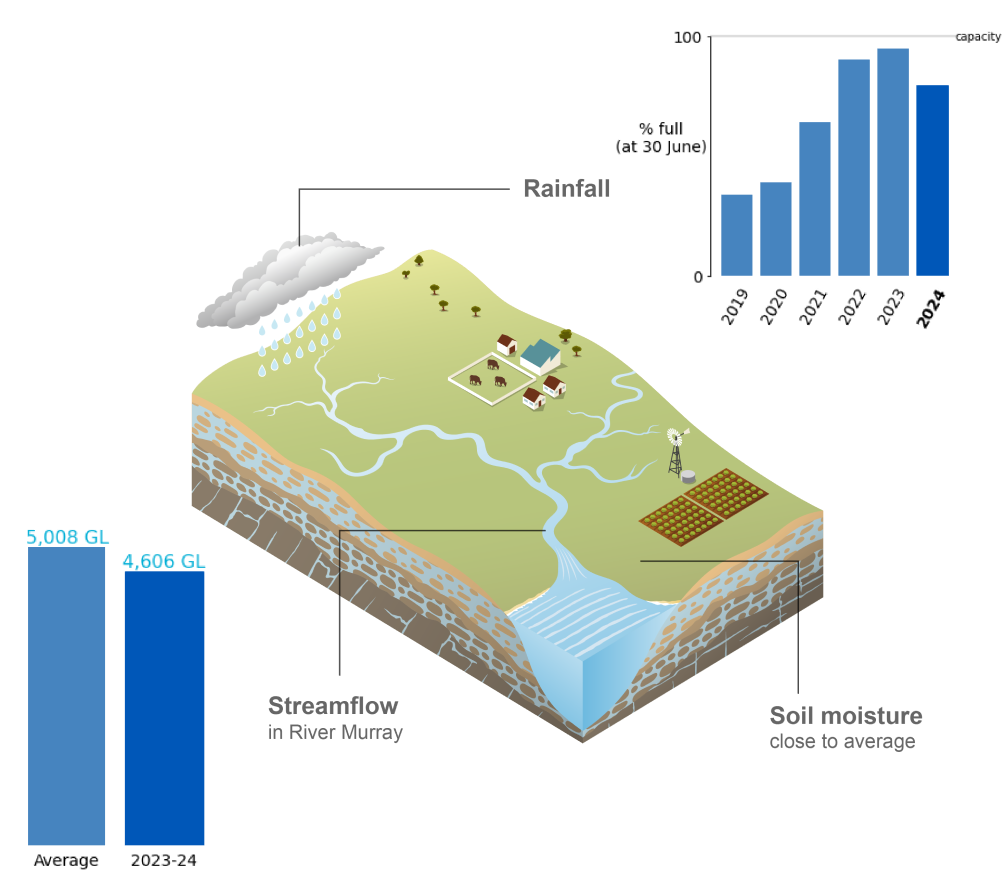
- Soil moisture in the root zone (0–1 m depth) was average or above average across much of the Basin but below average in parts of the south and north-east.
- Total annual flows in the region's major rivers were mostly above average, but below average in the north-east and some sites in the south.
This overview of climate and water conditions in the Murray-Darling Basin during 2022–23 includes:
About the region
- The Murray-Darling Basin's climate varies from sub-tropical in the north to semi-arid in the west and temperate in the south.
- Average rainfall across the region ranges from over 2,100 mm in the southeastern highlands to under 300 mm in the semi-arid western areas.
- In the north of the region, streamflows typically align with sub-tropical rainfall patterns, with higher flows during the late summer to early autumn months (January to March) following the summer rainfall peak.
- Streamflows in the southern part of the region reflect the temperate climate, with higher flows during the late winter to early spring months (August to October) following winter rainfall.
Climate conditions
Rainfall
Figure C1 Annual and monthly rainfall deciles for the Murray–Darling Basin region during the 2023–24 year
- Total area-averaged rainfall for the 2023–24 year was 478 mm, slightly higher than the long-term average of 467 mm. These average conditions followed three years of above-average rainfall in the region.
- While totals were average to above average over much of the Basin, parts of the south had very much below average (in the lowest 10% of years since 1901) rainfall.
- El Nino and positive Indian Ocean Dipole events were declared in September, both of which have typically been associated with drier and warmer conditions across the region.
- In contrast to the record rainfall of October 2022, totals were below average across most of the region up to October 2023 with three-month rainfall deficiencies developing in Queensland and northern New South Wales. Area-average rainfall in September 2023 was 5 mm, the lowest September rainfall since 1901.
- Following some notable rainfall in eastern Victoria in October, there were widespread thunderstorms and showers across the Basin throughout November. Monthly rainfall totals for November were above to very much above average in most areas.
- While some parts of the west experienced very much below average rainfall in December 2023, conditions in the south continued to be wetter through to January, with parts of Victoria receiving three to four times the mean monthly rainfall. January rainfall was nearly twice the basin average.
- From February 2024 onward, much of the central and northern Basin experienced average to above average rainfall, while in the south-west, rainfall was below to very much below average. Four-month rainfall (February to May) totals were lowest on record in parts of South Australia and western Victoria.
- For more information on Australia's climate and water in 2023–24 visit the Bureau's Financial Year Climate and Water Statement 2023–24.
Figure C2 Total monthly rainfall for the Murray–Darling Basin region during the 2023–24 year compared with the average and percentiles for the region
- Monthly rainfall from July to October was below average, with September rainfall the lowest on record (since 1901).
- Monthly area-averaged totals were above the 90th percentile in November 2023 and January 2024.
- Basin-averaged rainfall in December and February to June was closer to average.
Actual evapotranspiration
Figure C3 Annual and monthly actual evapotranspiration deciles for the Murray–Darling Basin region during the 2023–24 year
- Total area-averaged actual evapotranspiration for 2023–24 was predominantly average to above average across much of the Basin, but below average in the far south-west and north-east.
- Despite above average temperatures in the northern Basin in spring, low rainfall limited soil moisture availability and resulted in below average evapotranspiration.
- With high late spring and summer rainfall increasing landscape water availability, evapotranspiration was average to very much above average across much of the region.
- Monthly evapotranspiration remained mostly average to above average though to the end of 2023–24 in the northern Basin, while drier conditions in the south limited evapotranspiration from February.
Soil moisture
Figure C4 Annual and monthly soil moisture deciles for the Murray–Darling Basin region during the 2023–24 year
- Soil moisture in the root zone (0–1 m depth) for the 2023–24 year was average across much of the region, with areas of very much above average soil moisture in the central Basin and very much below in the east and south-west.
- Low rainfall and very much above average temperatures in early spring resulted in soil moisture deficits developing in the Northern Basin, the east, and the south-west, with parts of southern Queensland experiencing lowest soil moisture on record in September and October.
- November rainfall eased soil moisture deficits in the north, while rainfall through summer resulted in widespread above average soil moisture. In January, soil moisture in much of the southern Basin was very much above average, and some areas, particularly around the Goulburn-Broken catchment, soil moisture was the highest on record (since 1901).
- While rainfall through to the end of 2023–24 favoured mostly average to very much above average soil moisture in the northern Basin, low rainfall resulted in soil moisture deficits in the south, notably in the lower and upper Murray catchment areas.
- More information on soil moisture conditions across the Murray-Darling Basin is available on the Australian Water Outlook.
Streamflow responses
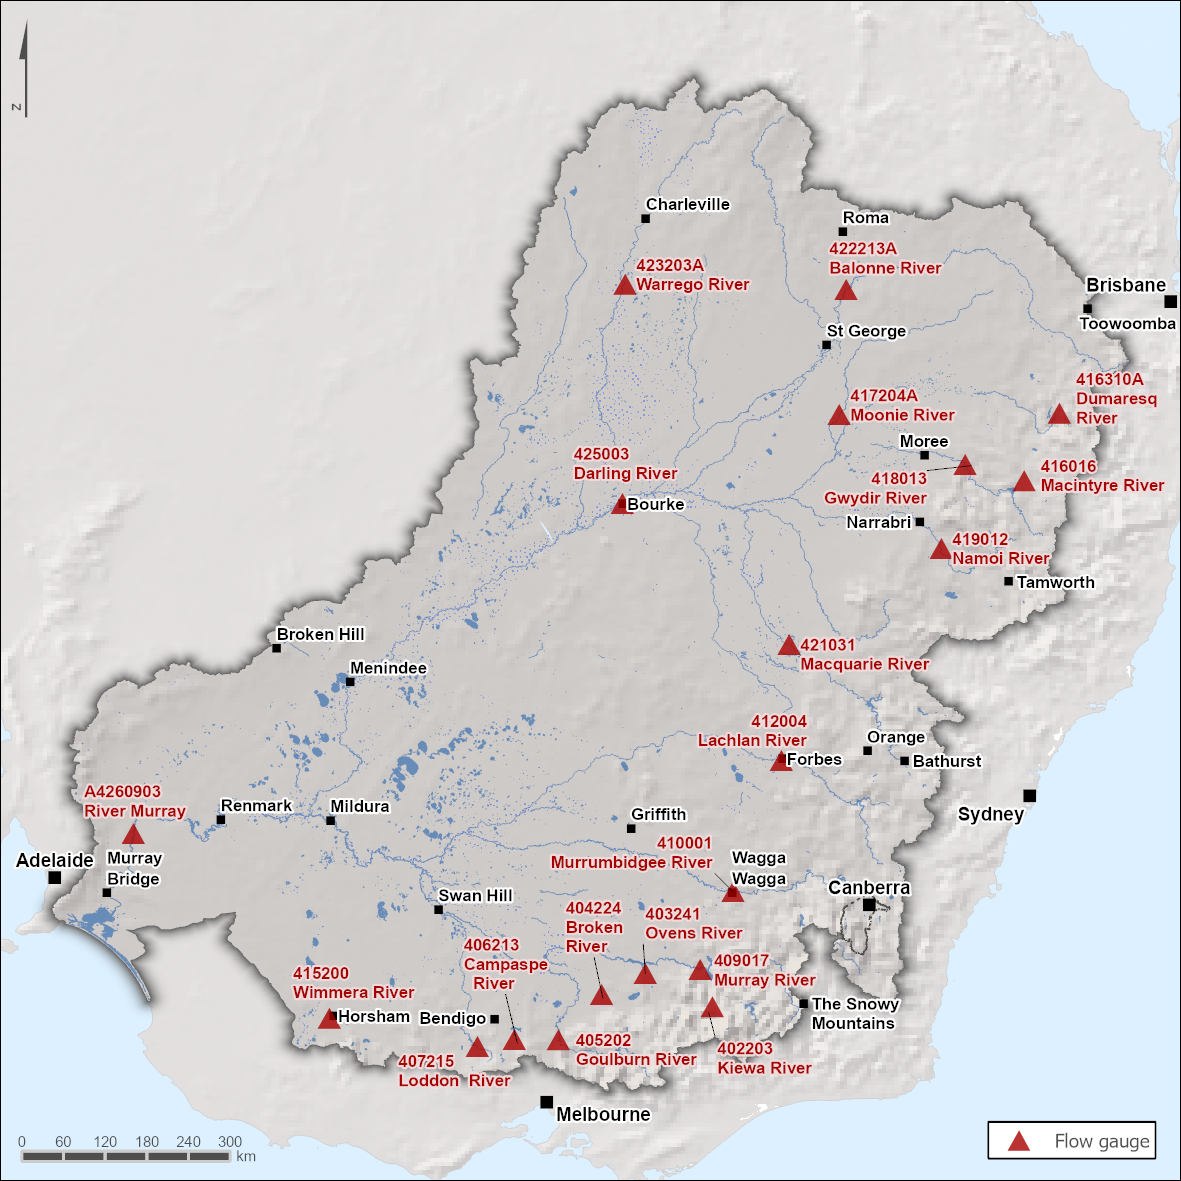
Figure C5 Key flow gauging stations along the main rivers
within the Murray–Darling Basin region
- The Murray and Darling rivers are the two primary river systems within the region. Streamflow in the Murray River is influenced by dam operations and diversions for consumptive use.
- The major tributaries of the Murray and Darling rivers in the southern part of the region are predominantly regulated while most of the major tributaries in the north are unregulated.
Figure C6 Total monthly flow for major rivers in the
Murray–Darling Basin region during the 2023–24 year
compared with the average and percentiles
- Annual streamflow in 2023–24 was average to above average at most gauges, but below average in the north-east and some sites in the far south.
- High flows (some above the 90th percentile) in the Basin's southern rivers in June 2023 continued into July causing minor to moderate flooding in the Murray and Edward Rivers, before decreasing into spring.
- Heavy rainfall in early October caused high flows and moderate flooding in the south-east, including the Goulburn River, Broken River and Ovens River catchments.
- Rainfall events in January significantly increased flow in the Campaspe River, with the total monthly flow at the Redesdale gauge the second highest for any January in the 48 year record.
- January and February rainfall across southern Queensland associated with ex-Tropical Cyclone Kirrily resulted in major flooding in the Moonie and Condamine River catchments. The total monthly flow at the Moonie River at Fenton (192.0 GL) was in the highest 5% of all February flows since 1972.
- At the beginning of April, a series of low pressure troughs drew tropical moisture south across Queensland, resulting in heavy rain and widespread flooding of western and southern Queensland that lasted for weeks as the water made its way south. The total monthly flow in the Warrego River at Wyandra (84.3 GL) was the second highest April flow on the record (58 years).
- In the far north-east of the Basin, flows remained low for most of the year. Total annual flow in the Dumeresq River at Farnbro was 0.85 GL compared with 89.6 GL in 2022–23.