The value reported in the water accounting statement (110,546 ML) represents the volume of water held in reservoirs and weirs operated by SA Water as at 30 June 2010. The volume reported for this line item includes dead storage (volume below the lowest outlet, which cannot be accessed under normal operating conditions). The volume in each storage at 1 July 2009 and 30 June 2010, as well as the capacity and dead storage, are provided in the table below.
| Reservoir | Total storage capacity (ML) | Dead storage capacity (ML) | Storage at 1 July 2009(ML) | Storage at30 June 2010 (ML) |
|---|---|---|---|---|
| Barossa Reservoir | 4,510 | 19 | 4,232 | 4,268 |
| Barossa Weir | 200 | 0 | 91 | 93 |
| Clarendon Weir | 320 | 2 | 268 | 204 |
| Gorge Weir | 24 | 0 | 20 | 11 |
| Gumeracha Weir | 200 | 0 | 199 | 129 |
| Happy Valley Reservoir | 12,700 | 71 | 9,234 | 10,100 |
| Hope Valley Reservoir | 2,764 | 123 | 2,105 | 2,257 |
| Kangaroo Creek Reservoir | 19,000 | 300 | 4,251 | 5,814 |
| Little Para Reservoir | 20,800 | 188 | 13,174 | 3,833 |
| Millbrook Reservoir | 16,500 | 188 | 13,053 | 14,873 |
| Mount Bold Reservoir | 45,900 | 27 | 24,378 | 16,703 |
| Myponga Reservoir | 26,800 | 163 | 13,981 | 17,451 |
| Onkaparinga Summit Reservoir | 427 | 64 | 204 | 168 |
| South Para Reservoir | 44,800 | 310 | 19,459 | 31,466 |
| Warren Reservoir | 4,770 | 0 | 4,842 | 3,176 |
| Total | 199,715 | 1455 | 109,491 | 110,546 |
The volume in each major storage (individual capacity > 1 GL) at 1 July 2009 and 30 June 2010 is compared to the capacity in the figure below. The percentage full for major storages at 30 June 2010 ranged from 18% for Little Para Reservoir to 95% for Barossa Reservoir. The percentage full exceeded 60% for most major storages.
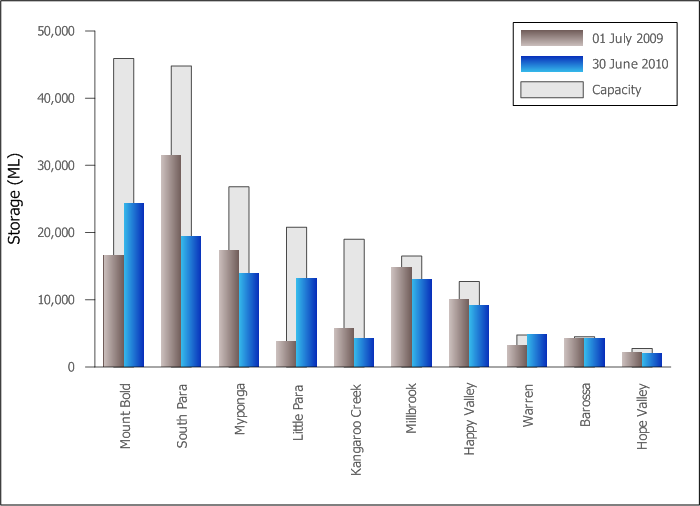
Graph of the capacity and volume at 1 July 2009 and 30 June 2010 for major storages in the Adelaide region
Bureau of Meteorology: Water Storages.
Bureau of Meteorology.
Storage volume was measured at 1 July 2009 and 30 June 2010 by using gauged water-level heights (mAHD) for individual storages. The height measurement was converted to a volume using the storage rating tables provided by SA Water.
The storage volume of individual storages was aggregated to present the total volume for the line item.
National Water Account 2010
Related links
Water links
