The volume reported in the water accounting statement (2431 ML) represents regional groundwater flow out of the Adelaide region from the major sedimentary aquifers in the McLaren Vale Prescribed Wells Area (PWA; Maslin Sands and Port Willunga aquifers) and Northern Adelaide Plains PWA (T1 and T2 aquifers) at the coastline and northern boundary. The dominant direction of groundwater flow in the Adelaide region is from the recharge area in the fractured rock aquifers of the Mount Lofty Ranges towards the St Vincent Basin in the west (Ellis and Fox 2004). The St Vincent Basin, including the major sedimentary aquifers, extends under the sea with only the shallow unconfined aquifers interacting with the sea at the coastline (Hodgkin 2004).
The regional groundwater outflow from the Adelaide region is provided by the aquifer and management areas listed in the table below.
|
Management area |
Aquifer |
Groundwater outflow (ML) |
|---|---|---|
|
McLaren Vale Prescribed Wells Area |
Maslin Sands |
9 |
|
Port Willunga Formation |
239 |
|
|
Northern Adelaide Plains Prescribed Wells Area |
T1 |
2,183 |
|
T2 |
<1 |
|
|
Total |
2,431 |
|
South Australian Department for Water: bore locations and groundwater-level data from Water Regulations.
Hydraulic conductivity and aquifer thickness data (Zulfic et al. 2008).
Bureau of Meteorology.
Groundwater flow into and out of the Adelaide Region was calculated using a simple Geographic Information System (GIS) approach based on Darcy’s Law (BoM 2010). Groundwater levels measured at monitoring bores (refer to figure below) were interpolated to a groundwater-level grid for each season during 2009–10 using the ArcGIS Topo-to-Raster tool. Seasonal groundwater flow grids were then derived from these groundwater-level grids along with aquifer thickness and hydraulic conductivity data using a modification of the ArcGIS Darcy Velocity tool. Groundwater inflow and outflow were subsequently calculated across selected boundaries in the Northern Adelaide Plains and McLaren Vale PWAs (refer to figure below) using a simple GIS analysis. Seasonal inflow and outflow volumes were summed to determine the total volume for 2009–10.
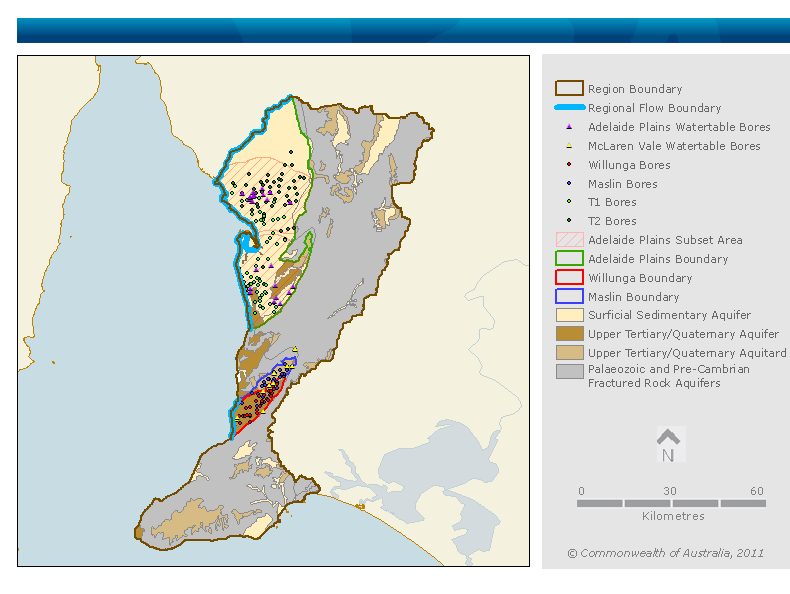
Map of hydrogeology within the Adelaide region and section of region boundary for which lateral groundwater flow was calculated
Ungraded.
National Water Account 2010
Related links
Water links
