The public water system within the Adelaide region is managed by SA Water. The tables below provide details of water abstractions, usage and recycling that occurred within metropolitan Adelaide during 2009–10. The figure below is a schematic of the water movements through the Adelaide public water supply system.
| Sources of water | Volume (ML) | Note | |
|---|---|---|---|
| Delivered via the water supply system (connected areas) | Water sourced from external entity | 47,853 | U4 + U5 |
| Water sourced from surface water | 149,649 | U1 | |
| Water sourced from groundwater | – | U2 | |
| Water sourced from recycling | 6,830 | U31 + U32 + part of U33 ** | |
| Total water sourced to supply connected areas | 204,332 | ||
| Directly abstracted water * | Water sourced from surface water | – | |
| Water sourced from groundwater | – | ||
| Water sourced from farm dam | – | ||
| Water sourced from rainwater tank | – | ||
| Total water directly sourced | – | ||
| Total water sourced | 204,332 | ||
* Data on directly abstracted water is unavailable or incomplete, and therefore not included in the scope of the National Water Account 2010
** Includes recycled water delivered to for urban purposes (i.e. excludes large-scale irrigation schemes such as the Northern Adelaide Irrigation Scheme)
– Term relevant to the Adelaide region, but could not be quantified
NA Term not applicable to the Adelaide region
| Water usage | Volume (ML) | Note |
|---|---|---|
| Residential—potable water | 85,957 | U9 |
| Residential—nonpotable water | – | |
| Commercial, industrial, municipal—potable water | 24,773 | U10 |
| Commercial, industrial, municipal—nonpotable water | – | |
| Other including agriculture, other and nonrevenue water—potable water | 30,804 | U11 |
| Other including agriculture, other and nonrevenue water—nonpotable water | – | |
| Environment—potable water | – | |
| Environment—nonpotable water | – | |
| Residential, commercial, industrial, municipal and other recycled water (excluding irrigation water the Northern Adelaide Irrigation Scheme) | 6,830 | U31 + U32 + part of U33 * |
| Total water use | 148,364 |
* Includes recycled water delivered to for urban purposes (i.e. excludes large-scale irrigation schemes such as the Northern Adelaide Irrigation Scheme)
– Term relevant to the Adelaide region, but could not be quantified
NA Term not applicable to the Adelaide region
| Water export | Volume (ML) | Note |
|---|---|---|
| Export—potable water | 3,627 | U7 |
| Export—nonpotable water | NA | U8 |
| Export—recycled water | NA | U29 |
| Total export | 3,627 |
– Term relevant to the Adelaide region, but could not be quantified
NA Term not applicable to the Adelaide region
| Water released to surface water | Volume (ML) | Note |
|---|---|---|
| Discharge to surface water—potable | 264 | U6a |
| Discharge to surface water—nonpotable | 43,859 | U6b |
| Total discharge to surface water | 44,123 | U6 |
– Term relevant to the Adelaide region, but could not be quantified
NA Term not applicable to the Adelaide region
| Wastewater produced and treated | Volume (ML) | Note |
|---|---|---|
| Wastewater collected within the entity | 87,771 | U19 |
| Wastewater (treated) produced for recycling | 24,809 | U30 |
| Wastewater (treated) discharged to surface water | 2,097 | U22 |
| Wastewater (treated) discharged to sea | 60,139 | U23 |
| Total treated wastewater discharged to surface water or to sea | 62,236 | U22 + U23 |
| Recycled water produced and supplied | Volume (ML) | Note |
|---|---|---|
| Total recycled water produced | 24,809 | U30 |
| Recycled water use on-site/in-process | 3,391 | U34 |
| Recycled water supplied to residential | 333 | U31 |
| Recycled water supplied to commercial, industrial, municipal | 2,420 | U32 |
| Recycled water supplied to agriculture | 3,935 | U33 |
| Recycled water supplied to environment | 142 | U33 |
| Recycled water supplied to artificial recharge | NA | |
| Recycled water supplied to irrigation scheme | 14,588 | U33 |
| Total recycled water supplied | 21,418 |
– Term relevant to the Adelaide region, but could not be quantified
NA Term not applicable to the Adelaide region
| Water supply area | Water restriction level | Date restriction level implemented | Date restriction level altered | Hand-held hose watering and drippers | Buckets or watering cans | Reticulation sprinklers | Swimming pools | Car washing | Hard surfaces |
|---|---|---|---|---|---|---|---|---|---|
| Adelaide to Murray supply areas | Level 3 enhanced (non-daylight saving) | 5 April 2009 | 4 Oct 2009 | 2 days/week with trigger nozzle, 7–10 am or 4–7 pm | Any time | Prohibited | No filling without permit | Bucket or commercial car wash only | No washing hard surfaces |
| Level 3 enhanced ii Watering hours changed (daylight saving) | 4 October 2009 | 17 Nov 2009 | 2 days/week with trigger nozzle, 6–9 am or 6–9 pm | ||||||
| Level 3 enhanced iii Watering hours increased to 5 hours/week | 17 November 2009 | 4 Apr 2010 | Maximum of 5 hours/week any day, 6–9 am or 6–9 pm | ||||||
| Level 3 enhanced iv Watering hours changed (non-daylight savings) | 4 April 2010 | 2 May 2010 | Maximum of 5 hours/week any day, 7–10 am and 4–7 pm | ||||||
| Level 3 enhanced v Watering hours increased to 7 hours/week | 2 May 2010 | 1 December 2010 | Maximum of 7 hours/week any day,7–10am and 4–7pm | ||||||
| Water Wise Measures | 1 December 2010 | NA | Any time | 5 pm –10 am (6 pm–10 am during daylight savings) | No restrictions | Bucket, commercial car wash or hose with trigger nozzle only |
| Losses | Volume (ML) | Note |
|---|---|---|
| Losses from potable water supplies | 14,135 | U15 |
| Losses from recycled water supplies | 425 | U36 |
| Losses from irrigation systems (supplied from surface water to irrigation scheme) | 182 | I7 |
| Total water losses | 14,742 |
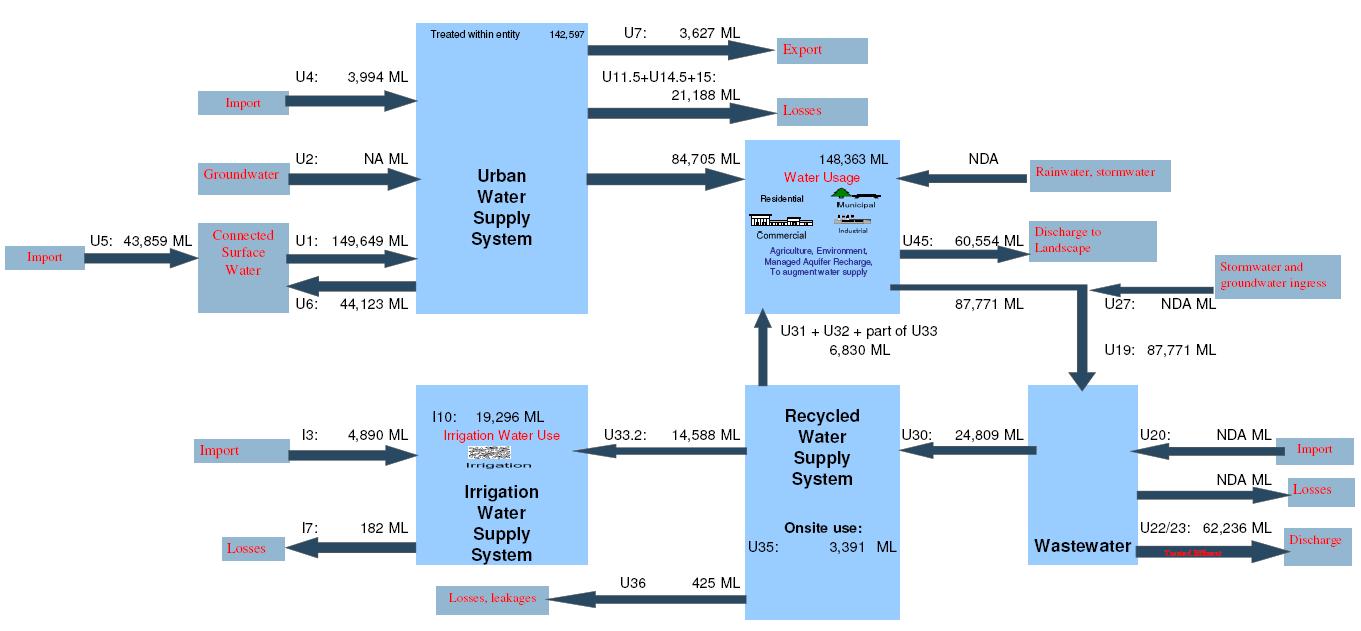
Schematic flow diagram of the public water supply system for the Adelaide region
149,649 ML
SA Water: Supervisory Control And Data Acquisition (SCADA) database.
Bureau of Meteorology: Water storage database, line item 13.1 Precipitation on connected surface water and line item 14.1 Evaporation from connected surface water.
Bureau of Meteorology.
This item refers to the flow of water from SA Water’s storages (connected surface water store) into their water treatment plants (water distribution system) to supply urban customers. The seven WTPs listed in the table below receive water from the connected surface water store.
|
Water treatment plant |
Quantification approach |
Water source |
|---|---|---|
|
Anstey Hill |
Metered inflow |
Myponga Reservoir |
|
Barossa |
Metered outflow × 1.05 |
Barossa Reservoir |
|
Happy Valley |
Metered inflow |
Happy Valley Reservoir |
|
Hope Valley |
Metered outflow × 1.05 |
Hope Valley Reservoir |
|
Little Para |
Metered inflow |
Little Para Reservoir |
|
Myponga |
Metered inflow |
Myponga Reservoir |
|
Summit Storage |
Metered inflow |
Summit Storage Reservoir |
Metered inflow data was obtained from the SA Water SCADA database for most of these WTPs. Inflow data was not available for the Barossa and Hope Valley WTPs. Barossa and Hope Valley WTP inflow was calculated from the respective WTP outflow allowing for a 5% loss through treatment process as shown in the table below.
|
Calculation |
Component |
Data source |
|---|---|---|
|
|
Transfer from Gorge Weir to Hope Valley Reservoir |
SCADA |
|
add |
Storage at 1 July 2009 |
Bureau of Meteorology Water Storage database |
|
minus |
Storage at 30 June 2010 |
Bureau of Meteorology Water Storage database |
|
add |
Precipitation |
Line item 13.1 Precipitation on connected surface water |
|
minus |
Evaporation |
Line item 14.1 Evaporation from connected surface water |
Uncertainty is +/–10% based on meter calibration.
Nil.
3,994 ML
Potable water is imported in the Adelaide region through the Swan Reach – Stockwell Pipeline (SRSPL) and from the Mount Pleasant Water Treatment Plant (WTP). Water imported via the SRSPL is treated at the Swan Reach WTP, and is used to supply consumers in the northern regions around Williamstown and for supply to Barossa Infrastructure Limited (BIL).
SA Water: Supervisory Control And Data Acquisition (SCADA) database, geographic information system (GIS) and customer service information system (CSIS) databases.
SA Water.
The total volume of potable water imported comprises the following two components:
A shapefile of the Adelaide region was used to extract the service point numbers (SPNs) of meters within the Adelaide region from the SA Water GIS. Only meters that were supplied with potable water from the Swan Reach and the Mt Pleasant WTPs were considered. The SPNs were then used to extract water meter readings for the 2009–10 reporting period for individual water meters from the SA Water CSIS database.
Water consumption was calculated by analysing the difference between consecutive meter readings and summed for 2009–10. To account for meter readings that occurred immediately before or after 2009–10, metered consumption was apportioned based on the following equation:
Vr = ( tr / tm ) × Vm
Where:
Vm = volume for metered period (kL)
Vr = volume for metered period within 2009–10 (kL)
tm = length of period between meter readings (days)
tr = length of metered period within 2009–10 (days).
Refer to Line item U6a Volume of potable water discharge to surface water from urban water supply system
Ungraded.
Nil.
43,859 ML
The table below summarises the volume of nonpotable water imported into the Adelaide region during 2009–10.
|
Pipeline |
Volume (ML) |
|---|---|
|
Mannum–Adelaide |
21,176 |
|
Murray Bridge – Onkaparinga |
22,683 |
|
Total |
43,859 |
Nonpotable water is imported into the Adelaide region for water supply through the Mannum–Adelaide Pipeline (MAPL) and Mt Bold – Onkaparinga Pipeline (MBOPL). However, not all imported water is used; some is stored for use in following years.
SA Water: Supervisory Control And Data Acquisition (SCADA) database and customer service information system (CSIS) database.
SA Water.
The nonpotable water imported into the Adelaide region in 2009–10 was determined by obtaining flow gauge measurements from the SA Water SCADA and CSIS databases.
Ungraded.
264 ML
This line item represents discharge from the Swan Reach – Stockwell Pipeline (SRSPL) into South Para River.
SA Water: Supervisory Control And Data Acquisition (SCADA) database.
SA Water.
The metered volume of potable water discharged from the SRSPL into South Para River during 2009–10 was requested from the SA Water SCADA database.
Ungraded.
Nil.
43,859 ML
The table below summarises the volume of nonpotable water imported into the Adelaide region during 2009–10.
Nonpotable water is imported into the Adelaide region for water supply through the Mannum–Adelaide Pipeline (MAPL) and Mount Bold – Onkaparinga Pipeline (MBOPL). However, not all imported water is used; some is stored for use in following years. For accounting purposes all imported water (reported in Line item U5 Volume of nonpotable water import) is also reported in this line item as a discharge, or release, to surface water.
SA Water: Supervisory Control And Data Acquisition (SCADA) and customer service information system (CSIS) databases.
SA Water.
The nonpotable water imported through MAPL and MBOPL into the Adelaide region in 2009–10 was determined from flow gauge measurements held in the SA Water SCADA and CSIS databases.
Ungraded.
3,627 ML
The Barossa, Onkaparinga Summit Storage and Myponga water treatment plants (WTPs), located within the Adelaide region, supply potable water to customers outside the region. The table below summarises the potable water exported during 2009–10.
|
Water treatment plant |
Volume (ML) |
|---|---|
|
Barossa |
877 |
|
Summit Storage (Onkaparinga) |
2,136 |
|
Myponga |
614 |
|
Total |
3,627 |
SA Water: Supervisory Control And Data Acquisition (SCADA) and customer service information system (CSIS) databases.
SA Water.
Geographic information system (GIS) analysis was used to extract the service point numbers (SPNs) of meters that are outside the Adelaide region, but are supplied with water by WTPs within the Adelaide region. The SPNs were then used to extract water meter readings for 2009–10 for each meter from CSIS.
Water consumption was calculated by analysing the difference between consecutive meter readings and summed for 2009–10. To account for meter readings that occurred immediately before or after 2009–10, metered consumption was apportioned based on the following equation:
Vr = ( tr / tm ) × Vm
Where:
Vm = volume for metered period (ML)
Vr = volume for metered period within 2009–10 (ML)
tm = length of period between meter readings (days)
tr = length of metered period within 2009–10 (days).
Ungraded.
Nil.
85,957 ML
SA Water: Supervisory Control and Data Acquisition (SCADA), geographic information system (GIS) and customer service information system (CSIS) databases.
SA Water.
A shapefile of the Adelaide region was used to extract the service point numbers (SPNs) of meters within the Adelaide region from the SA Water GIS database. The SPNs were then used to extract water meter readings for 2009–10 and primary land use codes for each meter from CSIS.
Water consumption was calculated by analysing the difference between consecutive meter readings and summed for 2009–10. To account for meter readings that occurred immediately before or after 2009–10, metered consumption was apportioned based on the following equation:
Vr = ( tr / tm ) × Vm
Where:
Vm = volume for metered period (kL)
Vr = volume for metered period within 2009–10 (kL)
tm = length of period between meter readings (days)
tr = length of metered period within 2009–10 (days).
The primary land use codes were reclassified as residential, commercial/industrial/ municipal or other. Then total water consumption for the Adelaide region was calculated by summing the 2009–10 water consumption for each meter based on the National Water Account 2010 land use classes.
Ungraded.
24,773 ML
Refer to Line item U9 Volume of water supplied for residential use.
The table below summarises the 2009–10 commercial, industrial and municipal consumption, including the original and reclassified land use.
|
Land use |
Consumption (ML) |
National Water Account 2010 land use |
|---|---|---|
|
Commercial |
7,226 |
Commercial |
|
Industrial |
6,766 |
Industrial |
|
Mining |
156 |
Industrial |
|
Public institution |
6,668 |
Municipal |
|
Public utility |
1,230 |
Municipal |
|
Recreational |
2,726 |
Municipal |
|
Total |
24,772 |
|
30,804 ML
The table below contains the breakdown of potable water supplied for uses other than residential, commercial, municipal and industrial uses.
|
National Water Account 2010 land use |
Consumption (ML) |
|---|---|
|
Agriculture |
12,364 |
|
Other |
4,303 |
|
Nonrevenue water |
14,135 |
|
Total |
30,804 |
The volume reported in this line item comprises:
The nonrevenue volume relates to supplied water that is not billed, including losses from leakage or pipe bursts, and water used to fill any change of volume of the supply system.
SA Water: geographic information system (GIS) and customer service information system (CSIS) databases.
Water Services Association of Australia (WSAA): 2009–10 National Performance Report (WSAA, in preparation).
SA Water.
Refer to Line item U9 Volume of water supplied for residential use for the quantification approach.
GIS analysis was used to determine the potable water supply system volume at the beginning of the reporting period (1 July 2009) and at the end of the reporting period (30 June 2010).
The difference between these volumes was considered to be the nonrevenue volume of water required to fill the increase of supply system.
Refer to Line item U15 Background leakage from potable water supply system for the quantification approach.
Derived from measured data. Estimated in the range +/–30% to 50%.
14,135 ML
SA Water: geographic information system (GIS) database.
Water Services Association of Australia (WSAA): 2009–10 National Performance Report (WSAA, in preparation).
SA Water.
GIS analysis was used to calculate the length of SA Water pipes within the Adelaide region. The leakage volume was calculated by multiplying this length and the 2009–10 mains loss rate for Adelaide, which is 3.6 kL/km/day (WSAA, in preparation).
Derived from measured data. Estimated in the range +/–30% to 50%.
87,771 ML
SA Water: wastewater treatment plant (WWTP) records.
SA Water.
The metered inflow to each WWTP within the Adelaide region was supplied by SA Water.
Ungraded.
2,097 ML
Refer to Line item 13.7.1 Urban wastewater discharge to connected surface water.
60,139 ML
Refer to Line item 20.4.2 Wastewater discharge out of entity.
24,809 ML
The table below lists the volume of recycled water produced by WWTPs in 2009–10 for commercial, industrial and municipal use.
|
Wastewater treatment plant |
Volume (ML) |
|---|---|
|
Aldinga |
328 |
|
Angaston |
80 |
|
Bird-in-Hand |
139 |
|
Bolivar |
18,406 |
|
Christies Beach |
3,525 |
|
Glenelg |
2,134 |
|
Gumeracha |
49 |
|
Hahndorf |
4 |
|
Myponga |
2 |
|
Victor Harbor* |
142 |
|
Total |
24,809 |
SA Water: wastewater treatment plant (WWTP) records.
SA Water.
The 2009–10 volume of recycled water produced was supplied from WWTPs operated by SA Water. The volume represents metered outflows that are manually read and recorded by plant operators.
Ungraded.
333 ML
SA Water: wastewater treatment plant (WWTP) records.
SA Water.
Only Bolivar WWTP supplies recycled water for residential use. This is water delivered to Mawson Lakes. Metered data relating to the volume of recycled water supplied for residential use was obtained from Bolivar WWTP records.
Ungraded.
Item does not include any Community Waste Management Schemes (CWMS), including the Port Elliot WWTP, which are managed by local councils.
2,420 ML
The table below lists the volume of recycled water produced by wastewater treatment plants (WWTPs) in 2009–10 for commercial, industrial and municipal use.
SA Water: WWTP records.
SA Water.
Measured meter data relating to the volume of recycled water supplied for commercial, industrial and municipal use in 2009–10 was obtained from SA Water WWTP records.
|
Wastewater treatment plant |
Application |
Volume (ML) |
|---|---|---|
|
Bolivar |
Mawson Lakes municipal use |
233 |
|
Glenelg |
Adelaide municipal use |
2,134 |
|
Gumeracha |
Commercial irrigation |
49 |
|
Hahndorf |
Commercial use |
4 |
|
Total |
|
2,420 |
Ungraded.
Item does not include any Community Waste Management Schemes (CWMS), including the Port Elliot WWTP, which are managed by local councils.
18,665 ML
The table below lists the volume of recycled water produced by wastewater treatment plants (WWTPs) in 2009–10 for uses other than residential, commercial, industrial and municipal.
|
Wastewater treatment plant |
Application |
Volume (ML) |
|---|---|---|
|
Aldinga |
Agriculture irrigation |
328 |
|
Angaston |
Agriculture irrigation |
80 |
|
Bolivar |
Agriculture irrigation via the Northern Adelaide Irrigation Scheme |
14,588 |
|
Christies Beach |
Agriculture irrigation |
3,525 |
|
Myponga |
Livestock irrigation |
2 |
|
Victor Harbor |
Environmental flow |
142 |
|
Total |
|
18,665 |
SA Water: WWTP records.
SA Water.
Measured meter data relating to the volume of recycled water supplied for uses other than commercial, industrial and municipal in 2009–10 was obtained from SA Water WWTP records.
Ungraded.
3,391 ML
The table below lists the volume of recycled water used on-site or in-process during 2009–10 by wastewater treatment plants (WWTPs).
|
Wastewater treatment plant |
Re-use |
Volume (ML) |
|---|---|---|
|
Bird-in-Hand |
Outdoor use |
139 |
|
Bolivar |
Recycled water used in-process |
3,252 |
|
Total |
|
3,391 |
SA Water: WWTP records.
SA Water.
The recycled water used on-site or in-process during 2009–10 was obtained from SA Water WWTP flow meter records.
Ungraded.
Nil.
3,821 ML
The table below presents a breakdown of the nonrevenue water for 2009–10.
|
Process |
Volume (ML) |
|---|---|
|
Line item U34 Volume of recycled water used on-site or in-process |
3,391 |
|
Line item U36 Background leakage from recycled water supply system |
425 |
|
Volume change in recycled water supply system |
5 |
|
Total |
3,821 |
SA Water: wastewater treatment plant records and geographic information system (GIS) database.
SA Water.
Nonrevenue water is the summation of:
The volume change within the recycled water supply system is the difference between the volume at the start of 2009–10 and the volume at the end of 2009–10. These volumes were determined by GIS analysis of the recycled water supply system.
Ungraded.
Nil.
425 ML
SA Water: geographic information system (GIS) database.
Water Services Association of Australia (WSAA): 2009–10 National Performance Report (WSAA, in preparation).
SA Water.
GIS analysis was used to calculate the length of SA Water recycled water supply system pipes within the Adelaide region (323.6 km). The leakage volume was calculated by multiplying this length by the 2009–10 mains loss rate for Adelaide, which was 3.6 kL/km/day (WSAA, in preparation).
Derived from measured data. Estimated in the range +/–30% to 50%.
This method assumes a recycled water mains length based on an initial and final length.
60,554 ML
The volume of irrigation application and other associated activities using potable and recycled water sourced from the water distribution system for 2009–10 is presented in the table below.
|
Source |
Activity |
Volume (ML) |
|---|---|---|
|
SA Water potable |
Country lands |
2,767 |
|
Household garden watering |
34,383 |
|
|
Mining |
156 |
|
|
Primary production |
1,536 |
|
|
Public institution |
2,667 |
|
|
Public utility |
1,230 |
|
|
Recreation |
2,726 |
|
|
Vacant land |
591 |
|
|
Total potable water |
50,947 |
|
|
Source |
Wastewater treatment plant |
Volume (ML) |
|
SA Water recycled water |
Aldinga |
328 |
|
Angaston |
80 |
|
|
Bolivar |
3,485 |
|
|
Christies Beach |
3,525 |
|
|
Glenelg |
2,134 |
|
|
Gumeracha |
49 |
|
|
Hahndorf |
4 |
|
|
Myponga |
2 |
|
|
Total recycled water |
9.607 |
|
|
Total potable and recycled water used for irrigation |
60,554 |
|
SA Water: wastewater treatment plant (WWTP) records.
SA Water.
This item comprises irrigation application associated with:
A shapefile of the Adelaide region was used to extract the service point numbers (SPNs) of meters within the Adelaide region from the SA Water geographic information system (GIS). The SPNs were then used to extract water meter readings for the 2009–10 for individual water meters from the SA Water customer service information system (CSIS) database.
Water consumption was calculated by analysing the difference between consecutive meter readings and summed for 2009–10. To account for meter readings that occurred immediately before or after the 2009–10, metered consumption was apportioned based on the following equation:
Vr = ( tr / tm ) × Vm
Where:
Vm = volume for metered period (kL)
Vr = volume for metered period within 2009–10 (kL)
tm = length of period between meter readings (days)
tr = length of metered period within 2009–10 (days).
The volume of potable water used for irrigation was estimated based on the primary land use code for each meter. The assumed proportion for irrigation is summarised by land use in the table below.
|
Land use |
Percentage used for irrigation |
|---|---|
|
Commercial |
0 |
|
Country lands |
100 |
|
Industrial |
0 |
|
Mining |
100 |
|
Primary production |
100 |
|
Public institution |
40 |
|
Public utility |
100 |
|
Recreational |
100 |
|
Residential |
40 |
|
Sundry |
0 |
|
Vacant land |
40 |
Source: OWS and DFW 2010
SA Water manages several WWTPs that produce recycled water for irrigation, specifically:
Recycled water volumes were extracted from a private database held by SA Water for these WWTPs.
Ungraded.
Nil.
This line item does not include any recycled water produced by Community Waste Management Schemes (CWMS), including the Port Elliot WWTP, which are managed by local councils, or other private schemes, such as North Para Environmental Control (NPEC) Pty Ltd and Willunga Basin Water Company.
4,890 ML
Barossa Infrastructure Limited (BIL): private database.
South Australian Department for Water.
The volume reported was calculated from the metered volume of water delivered to BIL, less the unaccounted for water.
Ungraded.
14,588 ML
SA Water: wastewater treatment plant (WWTP) records.
SA Water.
The item represents recycled water from Bolivar WWTP delivered to vegetable growers via the Virginia Pipeline. This volume was metered at Bolivar WWTP by the plant operator and supplied to SA Water.
Ungraded.
Nil.
182 ML
Barossa Infrastructure Limited (BIL): hard copy map of pipe network and leakage rate.
South Australian Department for Water.
The length of the BIL pipe network was determined from a hard-copy map and multiplied by a leakage rate of 2.66 kL/km/day to estimate the total leakage for 2009–10 (BIL manager, pers. comm., 2010).
Estimated uncertainty is +/–30% to 50%.
18,871 ML
Two irrigation distribution systems exist in the Adelaide region—the Barossa Irrigation Limited (BIL) and Virginia Pipeline schemes. This item consists of water supplied to the BIL and Virginia Pipeline schemes less any transmission losses.
BIL: private database.
South Australian Department for Water.
The volume of water applied from irrigation water distribution system is calculated as follows:
|
Calculation |
Component |
Data source (line item) |
|---|---|---|
|
Volume of water supplied from irrigation water distribution system = |
||
|
plus |
Volume of water import for irrigation supply |
I3 Volume of water import for irrigation supply |
|
plus |
Volume of water received from urban recycled water supply system |
I5 Volume of water received from urban recycled water supply system |
|
minus |
Leakages from irrigation supply system to groundwater |
I7 Leakages from irrigation supply system to groundwater |
Ungraded.
National Water Account 2010
Related links
Water links
