The public water system within Canberra region primarily supplies water to two areas – the Canberra metropolitan area and the Queanbeyan City Council. Public water system – related line item values in the water accounting statements report water supply to both these areas.
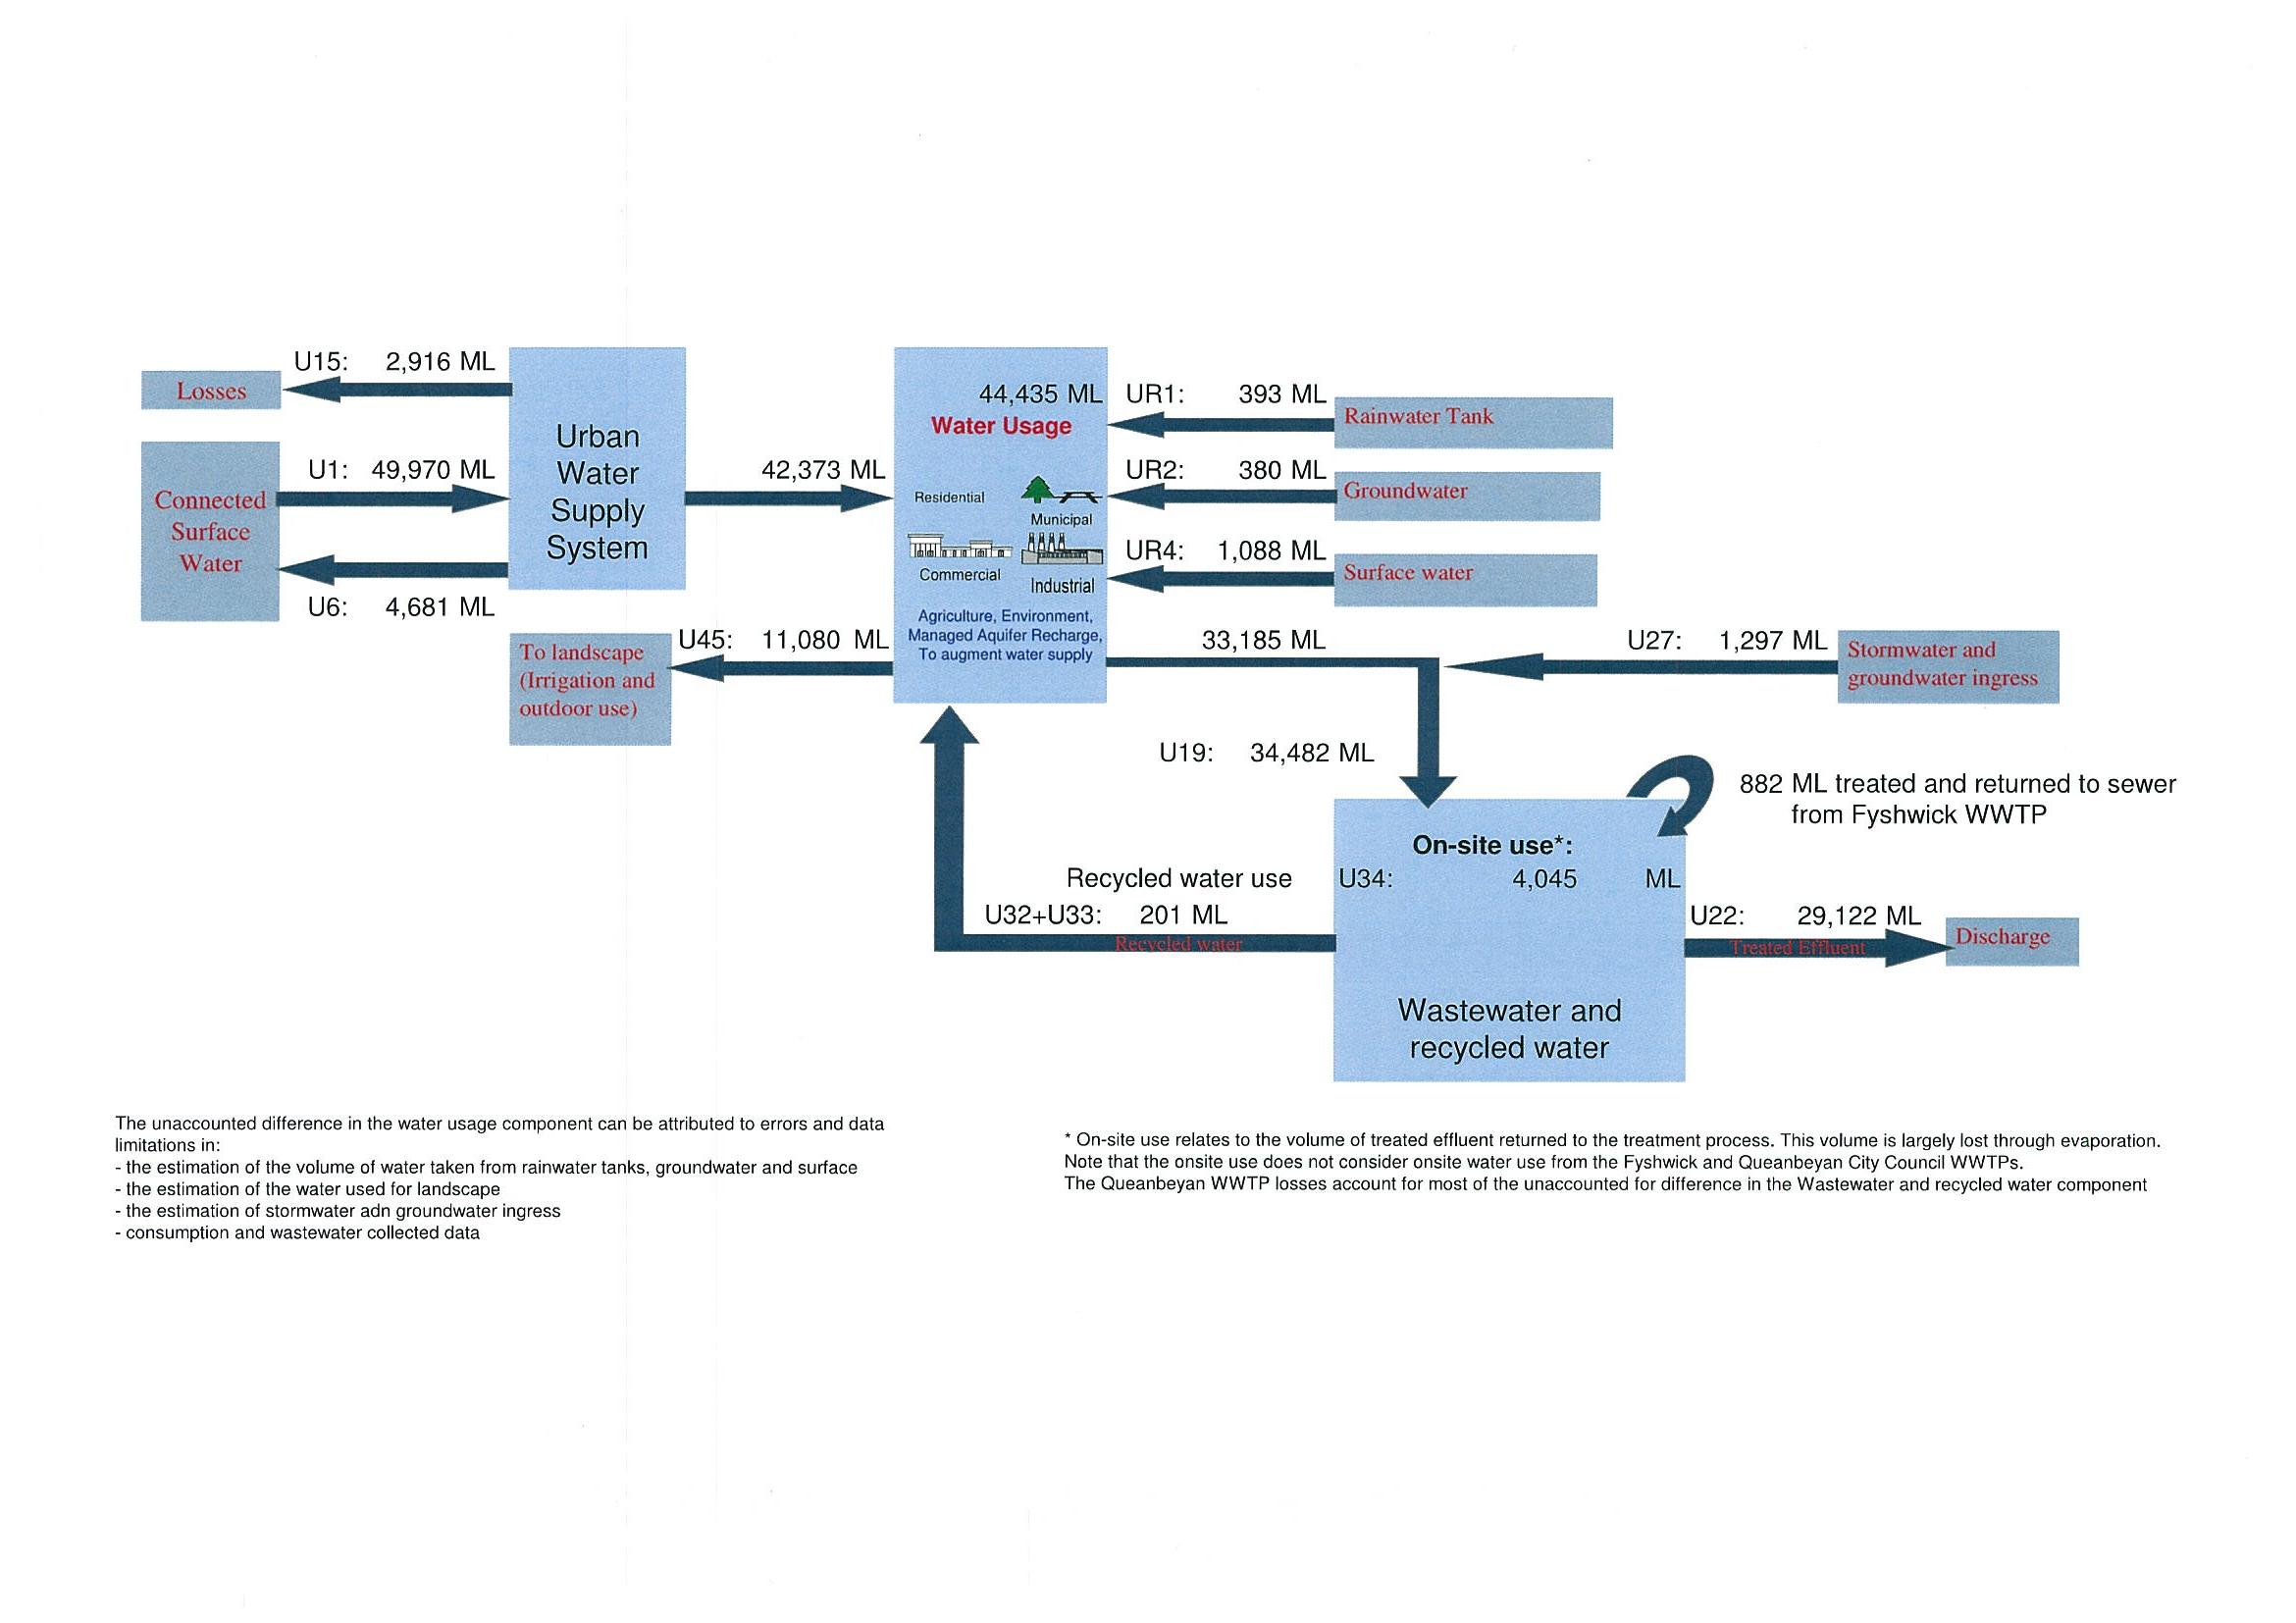
The data relating to the public water supply system for the Canberra region were provided by ActewAGL and Queanbeyan City Council. Tables 1–6 provide details of water abstractions, usage and recycling that occurred during 2009–10. Figure 1 is a schematic of the public water supply system.
Table 1 Sources of water supplied to the urban area
|
Sources of water |
Volume (ML) |
Note |
|---|---|---|
|
Water sourced from surface water |
49,970 |
U1 |
|
Ingress of stormwater into wastewater system |
1,297 |
U27 |
|
Total water |
51,267 |
|
Table 2 Water usage via urban potable water supply system
|
Water usage |
Volume (ML) |
Note |
|---|---|---|
|
Residential – potable water |
30,590 |
U9 |
|
Commercial, industrial, municipal – potable water |
10,885 |
U10 |
|
Potable water supplied other than for residential, commercial, municipal and industrial uses |
3,810 |
U11
|
|
Potable water discharged to surface water via urban water supply system |
4,681 |
U6 |
|
Total water use |
49,966 |
|
Table 3 Wastewater
|
Wastewater produced and treated |
Volume (ML) |
Note |
|---|---|---|
|
Wastewater collected within the entity |
34,482 |
U19 |
|
Total wastewater collected |
34,482 |
|
|
Wastewater (treated) discharged to surface water |
29,122 |
U22 |
|
Evaporation from wastewater treatment process |
3,240 |
U48 |
|
Total wastewater outflows |
32,362 |
|
Table 4 Recycled water
|
Recycled water produced and supplied |
Volume (ML) |
Note |
|---|---|---|
|
Recycled water supplied to commercial, industrial, municipal |
105 |
U32 |
|
Recycled water supplied other than for residential, commercial, municipal and industrial uses. |
96 |
U33 |
|
Recycled water use on-site / in-process wastewater used on-site |
4,045 |
U34 |
|
Total recycled water |
4,246 |
|
|
Water supply service area |
Water restriction level |
Date of restriction level |
Date restriction level altered |
|---|---|---|---|
|
Canberra |
Level 3 |
Implemented Dec 2006 |
Not altered during reporting period |
Table 6 Other urban water supply system water decreases
|
Losses |
Volume (ML) |
Note |
|---|---|---|
|
Leakage from potable, non-potable water supplies |
2,916 |
U15 |
|
Potable water discharge to surface water |
4,681 |
U6 |
|
Total water losses |
7,597 |
|
WWTP = wastewater treatment plant.
Figure 1 Schematic of the Canberra Urban Water Supply System.
49,970 ML of surface water taken for water supply and transferred from the Cotter and Murrumbidgee systems to Googong Reservoir.
ActewAGL production records.
ActewAGL.
The total volume taken from the connected surface water store for urban water supply in 2009–10 was calculated as the volume taken from the Cotter and Bendora reservoirs, the Murrumbidgee River and the Googong Water Treatment Plant. These numbers are measured using flow meters with values, obtained from the ActewAGL production records.
Derived from measured data. Estimated uncertainty is +/–5%.
ACTEW takes surface water from four sources, which supply two water treatment plants (WTPs). Water abstracted from the Cotter and Bendora reservoirs, and the Murrumbidgee River supply water to Mount Stromlo WTP. Water taken from Googong Dam supplies Googong WTP.
Surface water taken for water supply
|
Surface water source |
Water treatment plant |
Volume ( ML) |
|---|---|---|
|
Bendora Reservoir |
Mt Stromlo |
23,731 |
|
Cotter Reservoir |
Mt Stromlo |
12,564 |
|
Googong Reservoir |
Googong |
11,734 |
|
Murrumbidgee River |
Mt Stromlo |
1,941 |
|
Total |
|
49,970 |
4,681 ML of potable water discharged to surface water.
See Line item 20.7.
30,590 ML of potable water supplied for residential use.
ActewAGL billing data.
Queanbeyan City Council (QCC) billing data.
ActewAGL and QCC.
Data with a residential charge code were extracted from the billed metered consumption for 2009–10. The value is derived from measured data, with some postprocessing of the data. There is potential for errors in the data; for example, where an incorrect charge code has been applied to some meters. Raw water supplied to Uriarra Village is not included in this volume (see Line item U12).
The uncertainty is estimated to be of the order of +/–10%.
Nil.
10,885 ML of potable water supplied for commercial, industrial and municipal uses.
ActewAGL billing data.
Queanbeyan City Council (QCC) billing data.
ActewAGL and QCC.
Data with a commercial, industrial or municipal charge code were extracted from the billed metered consumption for 2009–10. The value is derived from measured customer water meter data, with some postprocessing of the data to align meter records with the reporting period. There is potential for errors in the data; for example, where an incorrect charge code has been applied to some meters.
The uncertainty is estimated to be of the order of +/–10%.
The data has assumed that all charge codes are correct.
3,810 ML of potable water supplied for other than residential, commercial, industrial and municipal uses.
ActewAGL: production records and billing data, Water Data Warehouse.
Queanbeyan City Council (QCC) billing data.
ActewAGL
Queanbeyan City Council
The volume of system losses in 2009–10 was calculated as the water taken from source water (Line item U1) less the water supplied (line items U6, U9, U10, U12). System losses include system leakage that is reported in Line item U15 and water distribution system volume change. The water distribution system volume change was calculated using data from ActewAGL Water Data Warehouse.
The system volume on 1 July 2009 was 524 ML, while the system volume on 30 June 2010 was 612 ML. Therefore, 88 ML reported as non-revenue water is due to system change.
The uncertainty is estimated to be of the order of +/–100%.
The reported volume includes only non-revenue water, consisting of losses through pipe leakage (also reported in Line item U15), water distribution volume change (e.g. service reservoir volume change and pipe volume change), and unbilled or unmetered potable water.
|
Calculation |
Component |
Line item |
Volume (ML) |
|---|---|---|---|
|
|
Surface water taken |
U1 |
49,970 |
|
minus |
Potable water discharge to surface water |
U6a |
4,681 |
|
minus |
Volume of potable water supplied for residential use |
U9 |
30,590 |
|
minus |
Volume of potable water supplied for commercial, industrial and municipal use |
U10 |
10,885 |
|
minus |
Volume of non-potable water supplied for residential use |
U12 |
4 |
|
equals |
|
|
3,810 |
4 ML of non-potable water supplied for residential use.
ActewAGL billing data.
ActewAGL
The volume of non-potable water supplied for residential use in 2009-10 was extracted from ActewAGL billing data. This is the total volume supplied to Uriarra Village, which may include components of use other than residential.
Uncertainty is estimated to be of the order of +/–10%.
This line item reports the volume of non-potable water supplied to Uriarra Village from the water supply system in 2009–10.
799 ML of non-potable water is used for environmental flows.
ActewAGL environmental flow records.
ActewAGL.
The volume of water transferred from the Murrumbidgee River to the Cotter River in 2009–10 was extracted from ActewAGL environmental flow records. The recorded volume was measured using Actew’s flow meters and extracted from Actew’s environmental flow records.
Data is measured. Uncertainty is estimated to be of the order of +/–5%.
Nil.
A component of the volume taken from surface water is used for environmental flows. This component is not counted as extraction under the water access entitlements nor is it considered part of urban supply. Environmental releases from the four dams operating in the Canberra region are not reported as water taken from surface water in this report. However, water pumped from the Murrumbidgee River and used for environmental flow in the Cotter River is counted here.
2,916 ML leakage from potable water supply system.
See line item 20.2.
34,482 ML of wastewater collected.
ActewAGL Water Data Warehouse.
Queanbeyan City Council (QCC) database.
ActewAGL and QCC.
The volume of wastewater collected was determined from measured sewer flow gauges extracted from the ActewAGL Water Data Warehouse and the QCC database. The total volume reported in this line item equals the total volume of wastewater collected from each wastewater treatment plant minus 882 ML that is discharged from Fyshwick Sewage Treatment Plant back into the sewer and retreated at Lower Molonglo Water Quality Control Centre.
|
Calculation |
Component |
Volume (ML) |
|---|---|---|
|
|
Total wastewater collected |
35,364 |
|
minus |
Discharge from Fyshwick Sewage Treatment Plant to Lower Molonglo Water Quality Control Centre |
882 |
|
equals |
|
34,482 |
This value is a measured value; ActewAGL estimate the uncertainty to be +/–5%.
The volume of wastewater which flowed into the wastewater treatment plants includes the volume of wastewater discharged to the sewer, as well as any net ingress of stormwater or groundwater to the sewer system.
The table below shows the volume of wastewater that flowed into the sewerage treatment plants in 2009–10.
|
Wastewater treatment plant |
Volume collected ( ML) |
|---|---|
|
Lower Molonglo Water Quality Control Centre |
30,193 |
|
Fyshwick Sewage Treatment Plant |
1643 |
|
Southwell Park Sewer Mining Facility |
2 |
|
Queanbeyan Sewage Treatment Plant |
3527 |
|
Total |
35,364 |
29,122 ML of treated wastewater discharged to surface water.
See line items 13.7.1 and 20.4.1.
1,297 ML ingress of stormwater/groundwater into the wastewater system.
See Line item 19.6.1.
4246 ML of recycled water produced from sewage.
ActewAGL Water Data Warehouse.
ActewAGL.
Reported volume is measured by flow meters and data retrieved from the ActewAGL Water Data Warehouse. Recycled water produced at the two sewerage treatment plants in the Canberra region (Lower Molonglo Water Quality Control Centre and Fyshwick Sewage Treatment Plan) and by a sewer mining plant (Southwell Park) is given in the table below.
Measured data. Uncertainty is estimated at +/–5%.
The Outward Bound Wastewater Treatment Plant (WWTP) was not included in the calculations as it is not connected to the water supply or sewerage systems, and use bore and rainwater at their WWTP site.
Recycled water produced from sewage
|
Wastewater treatment plant |
Volume (ML) |
|---|---|
|
Lower Molonglo Water Quality Control Center |
4228.0 |
|
Fyshwick |
16.7 |
|
Southwell Park |
1.6 |
|
Total |
4246.3 |
105 ML of recycled water used for commercial, industrial and municipal purposes
ActewAGL Water Data Warehouse.
ActewAGL.
Reported volume is measured by flow meters and data retrieved from the ActewAGL Water Data Warehouse. This number represents the volume of recycled water that was used for irrigation in commercial, industrial and municipal applications.
Measured data. Uncertainty is estimated at +/–5%.
Nil.
Recycled water used for irrigation
|
Wastewater treatment plant |
Purpose |
Volume (ML) |
|---|---|---|
|
Lower Molonglo Water Quality Control Centre |
Golf course irrigation |
81.65 |
|
Tanker supply |
5.07 |
|
|
Fyshwick |
Irrigation |
16.70 |
|
Southwell Park |
Irrigation |
1.55 |
|
Total |
104.97 |
|
96 ML of recycled water supplied for uses other than residential, commercial, industrial and municipal purposes.
ActewAGL Water Data Warehouse.
ActewAGL.
Metered data for agricultural water use in 2009–10 sourced from Lower Molonglo Water Quality Control Centre (LMWQCC) was extracted from the ActewAGL Water Data Warehouse.
Measured data, uncertainty is estimated at +/–5%.
Nil.
4,045 ML of recycled water use on-site/in-process wastewater used on-site.
ActewAGL Water Data Warehouse.
ActewAGL.
Metered data for agricultural water use in 2009–10 sourced from Lower Molonglo Water Quality Control Centre (LMWQCC) was extracted from the ActewAGL Water Data Warehouse.
Measured data, uncertainty is estimated at +/–5%.
This is the volume of treated effluent that is used within LMWQCC; this is water that is returned to the treatment process for re-treatment.
11,080 ML of potable water applied to landscape via the urban water supply system.
See Line item 20.3.2.
3,240 ML of wastewater lost through evaporation in treatment process.
See Line item 20.1.
393 ML of water obtained from rainwater tanks.
ACT Government Department of Environment, Climate Change, Energy and Water database.
ACT Government Department of Environment, Climate Change, Energy and Water.
Data is estimated, uncertainty is estimated at +/–50%.
The number of rainwater tanks used in this calculation is an estimate based on number of tank rebates. The number of tanks may be higher by an unknown factor.
This item refers to rainwater harvested into rainwater tanks in areas services by the reticulated sewerage system.
380 ML of water obtained from groundwater bores.
ACT Government Department of Environment, Climate Change, Energy and Water invoicing.
ACT Government Department of Environment, Climate Change, Energy and Water.
Groundwater licence data, which is used for invoicing, was summed to estimate the total volume of water taken via groundwater bores in 2009–10.
Data is estimated, uncertainty is estimated at +/–50%.
This volume is derived from invoicing and does not include unlicensed bores or unmeasured pumping.
This item refers to water sourced from groundwater bores in areas services by the reticulated sewerage system.
1,088 ML of water obtained from waterways.
ACT Government Department of Environment, Climate Change, Energy and Water invoicing.
ACT Government Department of Environment, Climate Change, Energy and Water.
License data, which is used for invoicing, was summed to estimate the total volume taken from waterways in 2009–10.
Data is estimated, uncertainty is estimated at +/–50%.
This volume is derived from invoicing and does not include unlicensed diversions and unmeasured pumping.
This item refers to water sourced from waterways in areas serviced by the reticulated sewerage system.
National Water Account 2010
Related links
Water links
