The volumetric value for the line item is 2,578 ML. Regional groundwater flow across the Murray–Darling Basin (MDB) reporting region boundary is only considered important in aquifers underlying the MDB surface drainage outlet to the Southern Ocean. (Note that groundwater flows in the Great Artesian Basin aquifers underlying the north of the MDB are not considered to be part of the water balance for the MDB region.)
Bore locations and groundwater level data in South Australia were sourced from the Water Regulations 2008 (category 2A) information returns provided by Department of Water South Australia (Provider Code W0078) to the Bureau of Meteorology.
Bore locations and groundwater level data in Victoria were sourced from the Department of Sustainability and Environment (DSE) through a database developed by the University of Melbourne (it is possible that small differences between the University of Melbourne database and the DSE groundwater database occur).
The geographic information system (GIS) data relating to the boundaries of the aquifers and Groundwater Management Units (GMUs) were extracted from the Interim Groundwater Geodatabase developed for the Bureau of Meteorology by Sinclair Knight Merz (SKM 2010a).
Bureau of Meteorology.
Regional groundwater flow across the MDB regional boundary is only considered to be significant in the area near the mouth of the Murray River in South Australia. The boundary through which groundwater flow is estimated is highlighted in the figure below. Groundwater flow was estimated for Murray Group Limestone and Renmark Group Aquifers that underlie this boundary but not including the boundary lengths co-incident with the coastline (flow across this boundary length is estimated in 15.1.2).
Groundwater flow was calculated using a simple GIS approach based on Darcy’s Law. Groundwater levels were interpolated for seasons using the ArcGIS Topo-to-Raster tool from reduced groundwater levels measured at monitoring bores. Seasonal groundwater flow-grids were derived from groundwater level grids, aquifer thickness and hydraulic conductivity using a modification of the ArcGIS Darcy Velocity tool. Groundwater flow across selected flow boundaries (see the following figure) was then calculated using a simple GIS analysis and seasonal values were aggregated to the 2009–10 reporting period.
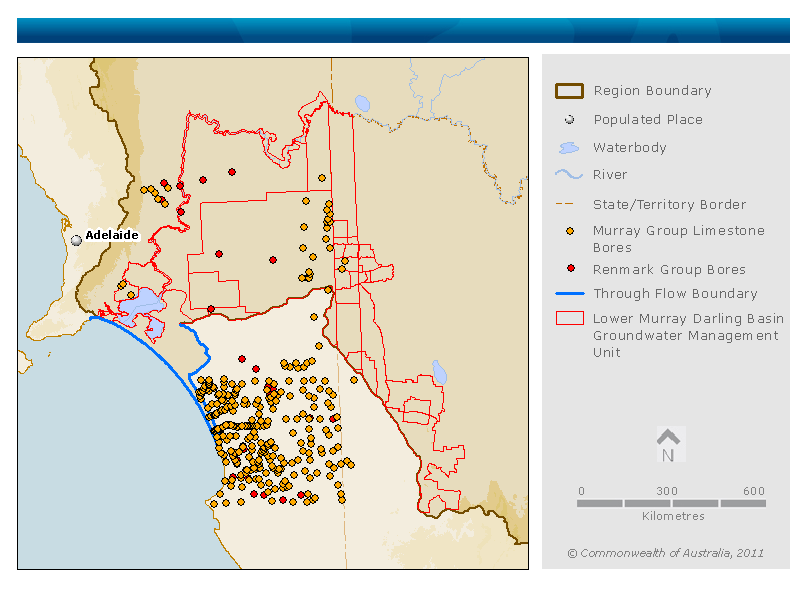
The surface water outlet of the Murray–Darling Basin region including the Murray River mouth and upstream (features shown include the boundary across which groundwater through-flow is calculated and groundwater observation bores used to estimate this flow)
The uncertainty is ungraded.
The uncertainty in the field-measured data (e.g. groundwater levels, hydraulic conductivity) was not specified and unknown, and hence the impacts of such uncertainty on the calculated groundwater flow were not estimated.
The regional flow estimations were based on the interpolated groundwater level grids produced using ArcGIS Topo-to-Raster tool. Use of different interpolation methods may impact on the values of the groundwater level grids and hence the estimated regional flow.
Groundwater flow was estimated for a simplified boundary constructed from a series of line segments. Groundwater flow across this boundary was calculated using the method described above. The uncertainty surrounding this simplification was not analysed.
National Water Account 2010
Related links
Water links
