This line item represents the volume of water that outflows to the sea.
Total annual volume of flow observed during 2009-10 at the most downstream station along the rivers that flow into the sea is given below.
|
River |
Station |
Total annual flow (ML) |
Quality codes |
|---|---|---|---|
|
Swan |
616084 |
4,406 |
1,2,11 |
|
616086 |
14,165 |
11,12 |
|
|
616076 |
272,462 |
1,2,3 |
|
|
Subtotal |
291,033 |
||
|
Canning |
616027 |
10,237 |
1,2,3 |
|
Murray |
614030 |
48,744 |
1,2,4 |
|
614063 |
14,994 |
1,2,4 |
|
|
614065 |
317,805 |
1,2,3 |
|
|
Subtotal |
381,543 |
||
|
Harvey |
613052 |
86,421 |
1,11 |
|
Total |
769,234 |
||
Note: Quality codes for flow data are:
1 Very good record 2 Very good record - corrections applied 3 Good record - corrections or estimations applied 4 Estimated record - good 11 Theoretical rating 12 Estimated rating
Western Australian Department of Water: Hydstra database.
Bureau of Meteorology.
The total volume of water that flows out to sea is the sum of the available volume of outflow from the four rivers that flow into the sea:
The surface water outflow was estimated using instantaneous discharge data (L/s) collected at the most downstream gauging station (nearest to the outlet to the sea) along a river. These data were converted to daily volume data (ML) to determine the total annual discharge (in ML) at each station during 2009-10.
The most downstream gauging stations along the main channels of the Swan and Murray rivers are 616076 and 614065, respectively. However, the figure below shows that two tributaries flow into the Swan and Murray main channels at a confluence downstream of these two gauging stations. Therefore, the total outflow from the Swan and Murray rivers was the sum of the total annual discharge at the most downstream station plus the total annual discharge measured along the two tributaries.
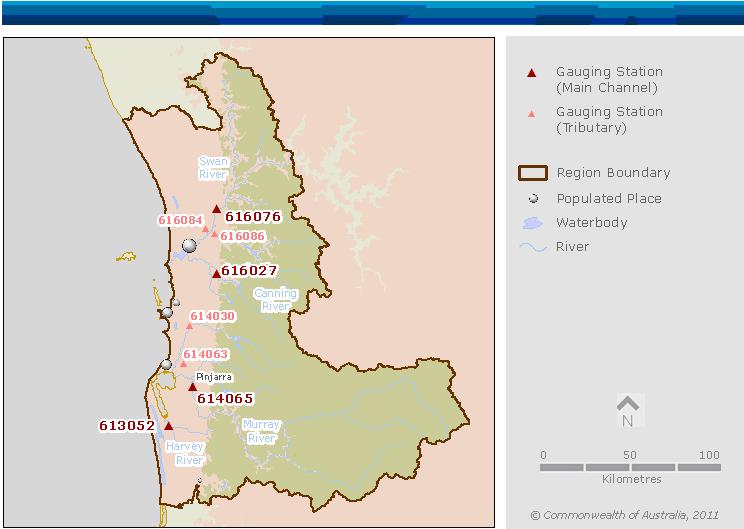
Location map of gauging stations used to calculate total outflow to sea
The Department of Water assigns quality codes to flow data in accordance with the following table:
|
Quality Code |
Description |
|---|---|
|
1 |
Very good record |
|
2 |
Very good record - corrections applied |
|
3 |
Good record - corrections or estimations applied |
|
4 |
Estimated record - good |
|
5 |
Estimated record - fair |
|
6 |
Estimated record - poor |
|
10 |
Estimated record - not reviewed / quality not known |
|
11 |
Theoretical rating |
|
12 |
Estimated rating |
The total volume of water that outflows into the sea has a quality code of 12. This quality code is the lowest quality of data recorded for all the station data. This was only recorded for a relatively short period of time (< 30 days) at station 616086. Most of the flow data recorded at the gauging stations was of a quality code 1-4.
It is assumed that the surface water outflow to the sea is equal to the volume of discharge measured at the most downstream station along a river. That is, there is no adjustment made for the contributing area below the gauging station used to calculate the outflow. This contributing area below the gauging stations is 9,173 km², approximately 43% of the total area of the Perth region. Based on a drainage-area ratio equation, estimated outflow is approximately 1,358,000 ML, which is 1.75 times that reported in the Statement of Physical Water Flows (769,234 ML). However, given that the ungauged component of the Perth region mainly lies on the Swan Coastal Plain, which is an area of relatively high rainfall-recharge, it is unlikely that this area will generate such a large amount of runoff. Instead, it is considered that the reported outflow to sea may be underestimated by 10-20%.
National Water Account 2010
Related links
Water links
