The tables below provide details of water abstractions, usage and recycling that occurred within the South East Queensland (SEQ) region during 2009–10. The figure below is a schematic of the water movements through the SEQ region’s public water supply system.
| Sources of water | Volume (ML) | Note | |
|---|---|---|---|
| Delivered via the water supply system (connected areas) | Water sourced from external entity | 25,084 | U4 |
| Water sourced from surface water | 193,985 | U1 | |
| Water sourced from groundwater | 456 | U2 | |
| Water sourced from desalination | 23,080 | U3 | |
| Water sourced from recycling | 15,358 | U30 | |
| Total water sourced to supply connected areas | 257,963 | ||
| Directly abstracted water |
Water sourced from surface water | ND | |
| Water sourced from groundwater | ND | ||
| Water sourced from local catchment reservoirs | ND | ||
| Water sourced from rainwater tank | ND | ||
| Total water directly sourced | ND | ||
| Total water sourced | 257,963 | ||
| No data (ND) on directly abstracted water was available and therefore not included in the scope ofthe National Water Account 2010 | |||
| Water usage | Volume (ML) | Note |
|---|---|---|
| Residential – potable water | 168,190 | U9 |
| Residential – non potable water | ND | |
| Commercial, industrial, municipal – potable water | 42,204 | U10 |
| Commercial, industrial, municipal – non potable water | ND | |
| Other including agricultural – potable water | 5,705 | U11 |
| Other including agricultural – non potable water | ND | |
| Environment – potable water | ND | |
| Environment – non potable water | ND | |
| Recycled water | 6,594 | U32 |
| Total water use | 222,693 | |
| Export – potable water | 0 | |
| Export – recycled water | 8,764 | U29 |
| Export – non potable water | NA | |
| Total export | 8,764 | |
| No data (ND) was available for a number of water usages and therefore not included in the scope of the National Water Account 2010 | ||
| Wastewater produced and treated | Volume (ML) | Note |
|---|---|---|
| Wastewater collected within the entity | 212,085 | U19 |
| Wastewater collected from external entity | NA | |
| Total wastewater treated | 212,085 | |
| Wastewater (treated) used for recycling | 15,358 | U30 |
| Wastewater (treated) discharged to surface water | 153,681 | U22a |
| Wastewater (treated) discharged to ocean | 1,182 | U23 |
| Other wastewater (treated) discharged. Undisclosed discharge point. | 41,864 | U22b |
| Total treated wastewater discharged | 196,727 | |
| Untreated wastewater exported | 123 | U21 |
| Recycled water produced and supplied | Volume (ML) | Note |
|---|---|---|
| Total recycled water produced | 15,358* | U30 |
| Recycled water use on-site/in-process | ND | |
| Recycled water supplied to residential | ND | |
| Recycled water supplied to commercial, industrial, municipal | 6,594 | U32 |
| Recycled water supplied to agricultural | ND | |
| Recycled water supplied to environment | ND | |
| Recycled water supplied to artificial recharge | ND | |
| Recycled water exported | 8,764 | U29 |
| Total recycled water supplied | 15,358 | |
| * Only Western Corridor recycled water was considered. | ||
| No data (ND) was available for a number of recycled water terms and therefore not included in the scope of National Water Account 2010 | ||
| Water supply service area | Water restriction level | Date restriction level implemented | Date restriction level altered |
|---|---|---|---|
| Brisbane | PWCM | 1 December 2009 | Level still current |
| Gold Coast | PWCM | 1 December 2009 | Level still current |
| Ipswich | PWCM | 1 December 2009 | Level still current |
| Lockyer Valley | PWCM | 1 December 2009 | Level still current |
| Logan | PWCM | 1 December 2009 | Level still current |
| Moreton Bay | PWCM | 1 December 2009 | Level still current |
| Redland | PWCM | 1 December 2009 | Level still current |
| Scenic Rim | PWCM | 1 December 2009 | Level still current |
| Somerset | PWCM | 1 December 2009 | Level still current |
| Sunshine Coast | PWCM | 1 December 2009 | Level still current |
| PWCM = Permanent Water Conservation Measures | |||
| Losses | Volume (ML) | Disclosure |
|---|---|---|
| Losses from potable, non-potable water supplies | 26,491 | U15 |
| Losses from recycled water supplies | ND | |
| Losses from irrigation systems (supplied from surface water to irrigation scheme) | 2,184 | I8 |
| Total water losses | 28,675 |
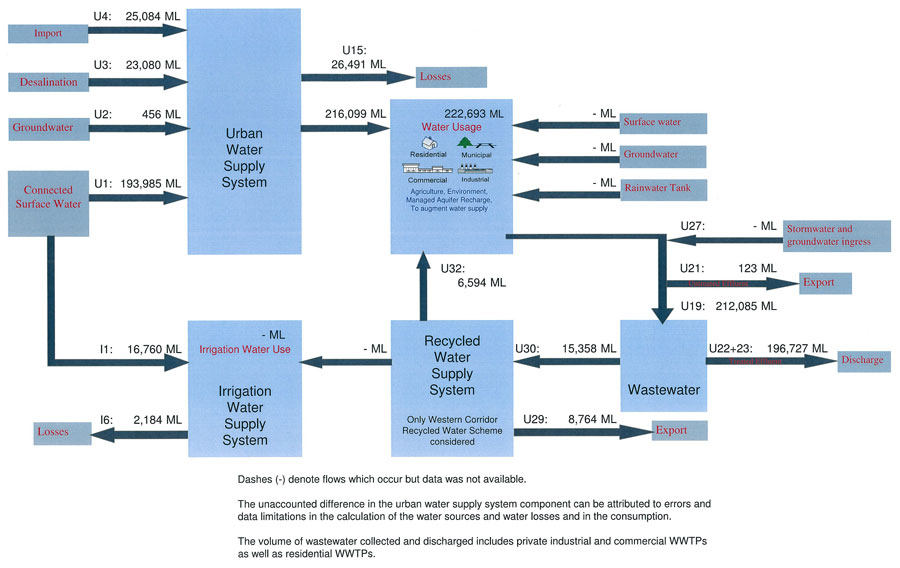
Schematic flow diagram of the public water supply system for the SEQ region
193,985 ML of water taken from surface water for water supply.
The volume of water taken from surface water for water supply in the 2009-10 reporting period is the summation of volumes summarised in Table 7. This was made up of:
| Water resource plan (WRP) area | Allocation diversions (ML) | Diversion of unregulated flows - urban water access entitlements (ML) | Diversion of unregulated flows - urban holder (ML) | Total (ML) |
|---|---|---|---|---|
| Gold Coast | 57,457 | 0 | 0 | 57,457 |
| Logan Basin | 2,315 | 5,517 | 706 | 8,538 |
| Moreton | 115,955 | 8,491 | 3,544 | 127,990 |
| Total SEQ region | 175,727 | 14,008 | 4,250 | 193,985 |
Refer to the following line items for quantification approach:
456 ML of water taken from groundwater for water supply.
Refer to Line Item 19.3.2 for quantification approach for the volume of water taken from groundwater for water supply.
23,080 ML of water taken from desalination for water supply.
Refer to Line Item 19.5.1 for quantification approach for the volume of water taken (import) from desalination for water supply.
25,084 ML of portable water import to South East Queensland (SEQ) Region.
Potable water imported into the SEQ region in the 2009–10 reporting period is the summation of Northern Pipeline Interconnector transfers, North Stradbroke Island transfers and indirect transfers through the Sunshine Coast local reticulation system.
Refer to Line Item 19.5.6 for quantification approach for the volume of potable water import.
168,190 ML.
| Land use group | Consumption (%) | Consumption volume (ML) |
|---|---|---|
| Residential | 77.83 | 168,190 |
| Commercial | 5.46 | 11,799 |
| Industrial | 5.12 | 11,064 |
| Large manufacturing industrial | 3.39 | 7,326 |
| Tourist | 2.08 | 4,495 |
| Rural | 0.94 | 2,031 |
| Irrigation | 0.56 | 1,210 |
| Public | 3.48 | 7,520 |
| Other | 1.14 | 2,464 |
| Total | 100 | 216,099 |
The total potable water consumption of the entire South East Queensland (SEQ) region in 2009–10 was the summation of the on-grid consumption plus the off-grid consumption. This was calculated as 216,099 ML.
It was assumed that the off-grid consumption was equal to the off-grid extractions for urban use. The quantification approach for off-grid extractions for urban use can be found in line item 14.6.5.4.
QWC: consumption records from the WaterHub database.
QWC.
A consumption breakdown by land use group was provided by QWC.
Ungraded.
The same consumption pattern for both on-grid and off-grid users was assumed.
42,204 ML.
Table 9 summarises the consumption breakdown percentage as reported by the Queensland Water Commission (QWC) and the resultant volume. The commercial, industrial, large manufacturing industrial, tourist and public land use groups, are considered in this line item.
| Land use group | Consumption (%) | Consumption volume (ML) |
|---|---|---|
| Residential | 77.83 | 168,190 |
| Commercial | 5.46 | 11,799 |
| Industrial | 5.12 | 11,064 |
| Large manufacturing industrial | 3.39 | 7,326 |
| Tourist | 2.08 | 4,495 |
| Rural | 0.94 | 2,031 |
| Irrigation | 0.56 | 1,210 |
| Public | 3.48 | 7,520 |
| Other | 1.14 | 2,464 |
| Total | 100 | 216,099 |
Refer to U9 for quantification approach for the consumption data and total consumption data.
5,705 ML.
Table 10 summarises the consumption breakdown percentage as reported by the Queensland Water Commission (QWC) and the resultant volume. The rural, irrigation and other land use groups are considered in this line item.
| Land use group | Consumption (%) | Consumption volume (ML) |
|---|---|---|
| Residential | 77.83 | 168,190 |
| Commercial | 5.46 | 11,799 |
| Industrial | 5.12 | 11,064 |
| Large manufacturing industrial | 3.39 | 7,326 |
| Tourist | 2.08 | 4,495 |
| Rural | 0.94 | 2,031 |
| Irrigation | 0.56 | 1,210 |
| Public | 3.48 | 7,520 |
| Other | 1.14 | 2,464 |
| Total | 100 | 216,099 |
Refer to U9 for quantification approach for the consumption data and total consumption data.
26,491 ML.
Refer to Line Item 20.2 for quantification approach for the background leakage from potable water supply system.
212,085 ML.
The volume of wastewater collected was assumed to be the sum of the following:
| Water resource plan (WRP) area | Discharge of urban wastewater to connected surface water | Other lumped wastewater discharge | Wastewater discharge out of entity | Other lumped recycled water discharge (ML) | Recycled water discharge out of entity (ML) | Total (ML) |
|---|---|---|---|---|---|---|
| Moreton | 89,014 | 37,496 | 0 | 6,594 | 8,764 | 141,868 |
| Logan Basin | 25,383 | 3,201 | 1,182 | 0 | 0 | 29,766 |
| Gold Coast | 39,284 | 1,167 | 0 | 0 | 0 | 40,451 |
| Total SEQ region | 153,681 | 41,864 | 1,182 | 6,594 | 8,764 | 212,085 |
The volume of treated wastewater discharged also includes private industrial and commercial wastewater treatment plants (WWTPs) as well as residential WWTPs. It was assumed that the WWTP discharge volumes provided by the Queensland Department of Environment and Resource Management (DERM) did not include recycled water volumes.
Refer to the following line items for quantification approach.
123 ML of wastewater (untreated) transferred out of the South East Queensland (SEQ) region.
Refer to Line Item 20.6.2 for quantification approach for the background leakage from potable water supply system.
153,681 ML.
Refer to Line Item 20.4.1 for quantification approach for the background leakage from potable water supply system.
41,864 ML of wastewater discharges to landscape.
Refer to Line Item 20.4.3 for quantification approach for the background leakage from potable water supply system.
1,182 ML of wastewater discharges to the sea.
Refer to Line Item 20.4.2 for quantification approach for the background leakage from potable water supply system.
8,764 ML of recycled water transferred to Tarong power station.
Refer to Line Item 20.6.1 for quantification approach for the background leakage from potable water supply system.
15,358 ML of recycled water was produced for use in the Western Corridor Recycled Water Reuse Scheme (WCRWRS).
Based on master meter readings in WaterHub provided by WaterSecure for Swanbank power station and Tarong power station).
SEQ Water Grid Manager.
The data related to the WCRWRS was extracted from the WaterSecure’s WaterHub database. Water via the WCRWRS was supplied to the Swanbank power station and exported for use at the Tarong power station. The WCRWRS receives recycled water from the Luggage Point, Gibson Island, Oxley, Wacol, Goodna and Bundamba wastewater treatment plant (WWTP) and the Luggage Point, Gibson Island and Bundamba advanced water treatment plants (AWTPs).
| Power station | Meter |
|---|---|
| Swanbank | M-091-MW |
| Tarong | M-086-MW |
No information is currently available on meter specifications.
Only recycled water produced for delivery via the WCRWRS was considered in this item. Data regarding recycled water produced from other WWTPs was not available.
6,594 ML of recycled water was supplied for commercial, industrial and municipal uses via the Western Corridor Recycled Water Reuse Scheme.
Refer to Line Item 20.5.3 for quantification approach for the background leakage from potable water supply system.
16,760 ML.
Table 13 summarises the available data pertaining to this item for the three sub-account regions. The reported volume is attributed to the Lower Lockyer, Central Lockyer and the Warrill Valley irrigation schemes.
|
Moreton water resource plan (WRP) area(ML) |
Logan Basin WRP area |
Gold Coast WRP area (ML) |
South East Queensland (SEQ) region |
|
|---|---|---|---|---|
|
Regulated flows |
14,200 |
739 |
5 |
14,944 |
|
Un-regulated flows |
402 |
1,419 |
NA |
1,821 |
|
Combined flows |
14,602 |
2,158 |
5 |
16,765 |
Refer to the following line items for quantification approach
2,184 ML.
Conveyance loss is the volume of water lost in the water supply scheme (WSS) delivery channels and pipes. Loss is generally calculated by subtracting metered use from the volume (measured) entering the channel and pipes. WSS operators provide this data. For the purpose of the National Water Account 2010, Queensland Department of Environment and Resource Management’s (DERM) distribution loss figures were used as conveyance losses.
The DERM Water Entitlement Register Database (WERD) and water management system (WMS) databases.
DERM.
The volume of leakage from the irrigation supply system to groundwater was extracted from the WERD and WMS databases. It was assumed that all distribution loss was due to leakage to groundwater.
Estimated uncertainty is A2.
The leakage of water to groundwater was only available for the Lower Lockyer and Warrill Valley irrigation schemes (Central Lockyer irrigation scheme was not included as no data was available).
National Water Account 2010
Related links
Water links
