Figure 1 and tables 1–7 summarise the water distribution for Wingecarribee Shire Council for 2009–10. The tables provide a breakdown for values shown in Figure 1. Notes for the values provided in tables 1–7 are shown after Table 7.
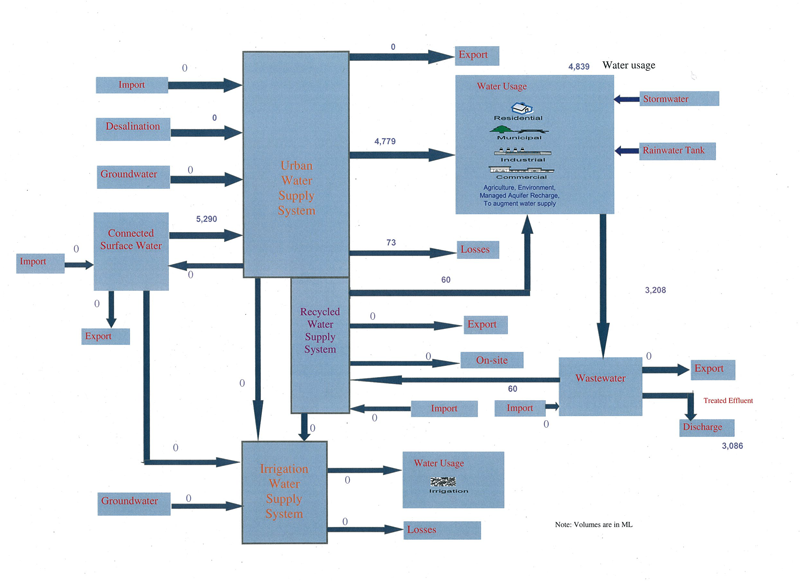
Figure 1.Diagram of water distribution summary for Wingecarribee Shire Council for 2009–10
| Item | Sources of water | Volume (ML) | Note identifier | |
|---|---|---|---|---|
| 1 | Delivered via the water supply system | Water sourced from external entity | Not applicable | |
| 2 | Water sourced from surface water | 5,290 | WSC_U1 | |
| 3 | Water sourced from groundwater | Not applicable | ||
| 4 | Water sourced from desalination | Not applicable | ||
| 5 | Water sourced from recycling | Not applicable | ||
| 6 | Total water sourced | 5,290 | Item 2 | |
| Item | Water usage | Volume (ML) | Note identifier |
|---|---|---|---|
| 1 | Residential – potable water | 4,779* | WSC_U9 |
| 2 | Commercial, industrial, municipal – potable water | WSC_U10 | |
| 3 | Total water use via urban water distribution system | 4,779 | Items (1+2) |
* Combined value for both items
| Item | Losses | Volume (ML) | Note identifier |
|---|---|---|---|
| 1 | Losses from potable, nonpotable water supplies | 73 | WSC_U15 & U17 |
| 2 | Losses from recycled water supplies | Not available | |
| 3 | Total water losses | 73 | Item 1 |
| Item | Wastewater collected and treated | Volume (ML) | Note identifier |
|---|---|---|---|
| 1 | Wastewater collected and treated within the entity | 3,208 | WSC_U19a* |
| 2 | Wastewater collected and treated from external entity | 0 | |
| 3 | Total wastewater collected and treated | 3,208 | Item 1 |
* WSC_U19a which is the note for wastewater collected also applies for wastewater treated.
| Item | Wastewater discharged | Volume (ML) | Note identifier |
|---|---|---|---|
| 1 | Treated wastewater discharged to surface water | 3,086 | WSC_U22 |
| 2 | Treated wastewater discharged to ocean | Not applicable | |
| 3 | Total volume discharged | 3,086 | Item 1 |
| Item | Recycled water produced and supplied | Volume (ML) | Note identifier |
|---|---|---|---|
| 1 | Total recycled water produced | 60 | WSC_U30 |
| 2 | Recycled water supplied to commercial, industrial, municipal | 60 | WSC_U32 |
| 3 | Total recycled water supplied | 60 | Item 2 |
| Item | Component | Volume (ML) | Reference |
|---|---|---|---|
| 1 | Water use from potable and nonpotable water supply | 4,779 | Table 2 |
| 2 | Water use from recycled water supply | 60 | Table 6 |
| 3 | Total water use | 4,839 | Items (1 + 2) |
WSC_U1 5,290ML
ABB Magflow meters based at raw water pump stations that feed water treatment plants, the Supervisory Control and Data Acquisition (SCADA) system and Wingecarribee Shire Council data spreadsheets.
Wingecarribee Shire Council.
This item represents the total volume of surface water taken for water supply. The total volume is derived from Magflow meter data received through the SCADA system and transported into spreadsheets.
| Surface water taken at water treatment plants (WTPs) | Volume (ML) |
|---|---|
| Bundanoon Reservoir to Bundanoon WTP | 530 |
| Medway Reservoir to Medway WTP | 981 |
| Wingecarribee Reservoir (supplier: Sydney Catchment Authority) supplies to Wingecarribee WTP (see assumptions for this note) | 3,779 |
| Total volume | 5,290 |
The volumes provided by Wingecarribee Shire Council have been derived from measured data. Estimated accuracy based on meter accuracy is +/–7%.
The volume from Wingecarribee Reservoir to Wingecarribee Water Treatment Plant recorded by the bulk water supplier, the Sydney Catchment Authority, is 3,652 ML. This UrbanSAT note is based on data provided by Wingecarribee Shire Council, but the accounting statements for the Sydney Region show the volumes recorded by the bulk supplier to maintain consistency in calculation (see Line item 14.7.4). The data suppliers suggest limits of meter accuracy as the reason for the difference.
and
Combined volume of WSC_U9 and WSC_U10 4,779 ML
ABB Magflow meters to measure outflows at water treatment plants, the Supervisory Control and Data Acquisition (SCADA) system and Wingecarribee Shire Council data spreadsheets.
Wingecarribee Shire Council.
This item represents the total volume of potable water supplied for residential, commercial, industrial and municipal use. The total volume is derived from data collected from calibrated outflow meters at water treatment plants, minus the volume estimated as leakage and bursts (73 ML used, as U15 + U17).
The volume is based on measured data. Estimated uncertainty based on meter accuracy is +/–7%.
Information required to separate the volume of potable water supplied to residential; and commercial, industrial and municipal use categories is not available.
and
Background leakage represents water loss from the system in slow, diffuse or continuous egress forms. A burst is a rupture at a point in the system that generally results in loss of water in fast, point-based or event-based egress forms.
Data provided as U15 and U17 are used for representing the total loss due to background leakage and pipe bursts from the potable water supply system. A breakdown on these items is not available. The total volume of leakage and loss is taken as an input to the ‘Landscape’ water store as the breakdown of the component entering ‘groundwater’ is not available separately.
WSC_U15 and WSC_U17 73 ML
Wingecarribee Shire Council data spreadsheets.
Wingecarribee Shire Council.
The value represents the total volume of leakage and loss from the potable water supply system. The volume is based on the water balance method where potable water production figures from the water treatment plants are configured with the consumption figures obtained by flow meter readings at listed properties.
The volume is based on measured data. Estimated uncertainty based on meter accuracy, professional judgment and organisational practice is +/–20%.
From 2010–11, the council is using a product called ‘Active leakage’ where actual flow measurement is taken on night flows. This is believed to produce uncertainty estimates within the range +/–5%.
and
Note: Information provided on WSC_U19a is also assumed to be applicable for WSC_U19b.
WSC_U19a / WSC19b 3,208 ML
Plant Supervisory Control and Data Acquisition (SCADA) data from wastewater treatment plants.
Wingecarribee Shire Council.
This item represents the total volume of wastewater collected and treated (U19a/U19b) at wastewater treatment plants. The volume is derived from inflow meter data at wastewater treatment plants, where applicable.
| Wastewater treatment plant | Wastewater collected/treated (ML) |
|---|---|
| Berrima | 78 |
| Bowral | 1,169 |
| Braemar | 865 |
| Bundanoon | 303 |
| Moss Vale | 793 |
| Total | 3,208 |
The volume is based on measured data. Estimated uncertainty based on meter accuracy and professional judgment is +/–7%.
Total wastewater received can include net ingress from stormwater and groundwater. Inflows to plants have only been measured at Moss Vale, Berrima and Bundanoon wastewater treatment plants. Therefore, treated volumes shown above are the same as discharge volumes shown under ‘Volume of (treated) wastewater discharged to surface water’ for these plants (see U22).
WSC_U22 3,086 ML
Supervisory Control and Data Acquisition (SCADA) data from wastewater treatment plants.
Wingecarribee Shire Council.
The value represents the total volume of treated wastewater discharge to surface water from wastewater treatment plants.
The flow of wastewater from the plants is measured using ABB Magmaster flow meters installed on-site. The data from the flow meters are continually monitored and recorded. External flow verification audits for the flow meters are conducted annually by Hydrometric Consulting Services.
| Wastewater treatment plant | Discharging to watercourse | Volume discharged during 2009–10 (ML) |
|---|---|---|
| Berrima | Olbury Creek | 78 |
| Bowral | Wingecarribee River | 1,127 |
| Braemar | Iron Mines Creek | 785 |
| Bundanoon | Reedy Creek | 303 |
| Moss Vale | Whites Creek | 793 |
| Total | 3,086 | |
The volume is based on measured data. Estimated uncertainty based on meter accuracy and professional judgment is +/–7%.
Nil.
WSC_U30 60 ML
Data spreadsheet on flow meter readings at the Mittagong Golf Club.
Wingecarribee Shire Council.
This item represents the total metered volume of recycled water produced from sewage at Braemar Wastewater Treatment Plant. The volume is from the flow meter readings from Tyco magflow meter at the receiving end, the Mittagong Golf Club. Flow meter readings have been logged into a council database to produce a data spreadsheet.
The volume is based on measured data. Estimated uncertainty based on meter accuracy and professional judgment is +/–7%.External flow verification audits for the flow meters are conducted annually by Hydrometric Consulting Services.
Total volume of recycled water produced from sewage is assumed to be equal to the volume reused at the Mittagong Golf Club.
WSC_U32 60 ML
See ‘U30 Volume of recycled water produced from sewage’
National Water Account 2010
Related links
Water links
