


South Pacific tropical cyclone season
Tropical cyclone season planning
- The South Pacific's tropical cyclone season runs from November to April.
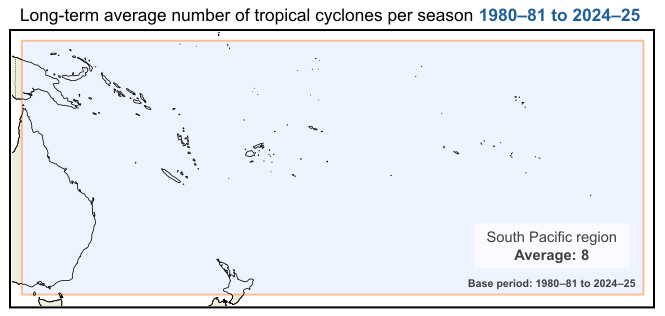
- On average, there are around 8 tropical cyclones in the South Pacific region each season (based on all seasons since 1980–81).
- Tropical cyclone formation is rarely evenly spread throughout the season; quiet periods are often followed by bursts of activity.
- Tropical cyclones can cause damaging winds, heavy rainfall and flooding, large waves, storm surge and coastal inundation.
- Although wind speeds of tropical lows are lower, they can also cause these impacts, as well as impact areas further inland.
- Coastal impacts can still occur from tropical cyclones that don't make landfall.
- Rising sea levels are increasing the risk of coastal impacts from storm surge.
- Future tropical cyclones may be fewer but stronger, bringing intense rainfall, damaging winds and dangerous storm surge.
- Pacific National Meteorological Services can be contacted for local tailored warnings and information relating to tropical cyclone preparedness.
Most tropical cyclones form during the South Pacific tropical cyclone season (November to April). However, given some systems form outside this period, the statistics use the full 12-month period from July to June.
See also: Long-range forecasts for the Pacific. This page includes multi-week tropical cyclone forecasts (based solely on ACCESS-S model guidance) for the South Pacific region.
Last updated: October 2025
Further information
Monitoring and forecasts
- Tropical Climate Update
- Tropical (MJO) monitoring
- Southern Oscillation Index (SOI)
- SST indices
- SST analysis maps
- SST outlooks
- Latest Northern wet season summary
- Tropical cyclone climatology maps
South Pacific
Tropical cyclone knowledge centre
Product code: IDCKSPTCSO
![]() Unless otherwise noted, all maps, graphs and diagrams in this page are licensed under the Creative Commons Attribution 4.0 International Licence
Unless otherwise noted, all maps, graphs and diagrams in this page are licensed under the Creative Commons Attribution 4.0 International Licence
