


Australian tropical cyclone season
See also:
7 day tropical cyclone forecastTropical cyclone season planning

- On average, there are 10 tropical cyclones in the Australian region each season with 3–4 making landfall (based on all seasons since 1980–81).
- Since 2000, the average number of cyclones each season has been closer to 8–9.
- There has always been at least one tropical cyclone that crosses the Australian coast each season.
- Tropical cyclone formation is rarely evenly spread throughout the season; quiet periods are often followed by bursts of activity.
- Tropical cyclones can cause damaging winds, heavy rainfall and flooding, large waves, storm surge and coastal inundation.
- Although wind speeds of tropical lows are lower, they can also cause these impacts, as well as impact areas further inland and further south.
- Coastal impacts can still occur from tropical cyclones that don't make landfall.
- Rising sea levels are increasing the risk of coastal impacts from storm surge.
- Future cyclones may be fewer but stronger, bringing more intense rainfall, damaging winds and dangerous storm surge.
Most tropical cyclones form during the official tropical cyclone season (November to April). However, given some systems form outside this period, the statistics use the full 12-month period from July to June.
See also: Tropical cyclone warning services
Last updated: October 2025
Latest season
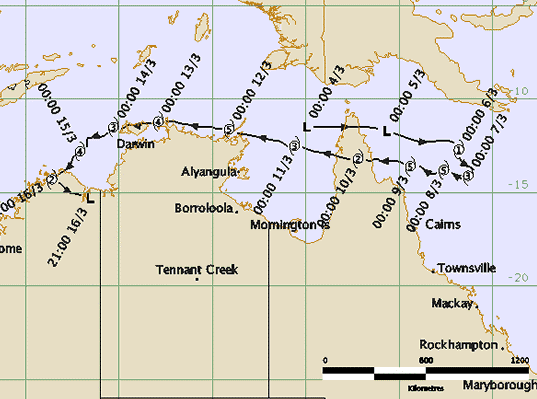
Track cyclone activity for the current season (July to the following June) or explore past seasons. Only cyclones that reached TC-strength (Category 1 or higher) within the Australian region are shown, but track points both inside and outside of the domain are included for this chart. Coordinates outside of the domain are denoted in red. Tropical cyclone activity levels vary within and between seasons. Data source: Australian Tropical Cyclone Database.
In the chart, each line shows a cyclone's duration, with color indicating its intensity over time. Click and drag the chart area to zoom. Use the legend to toggle items.
Comparison of latest season to past seasons
Compare tropical cyclone activity during the latest season with previous seasons. Data source: Australian Tropical Cyclone Database.
In the chart, each line shows how tropical cyclone counts evolved during the season. Click and drag the chart area to zoom. Use the legend to toggle items.
Tropical cyclone climatology, including where and when they occurred
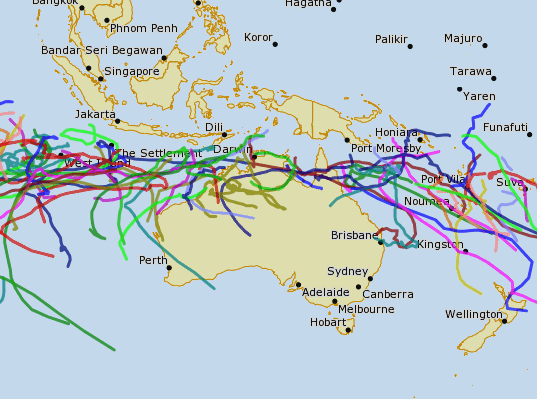
- Tropical cyclone activity in the Australian region varies substantially from year to year; no two seasons are the same.
- Trends in tropical cyclone activity have and will continue to change over time.
See: Future seasons. - Data source: Australian Tropical Cyclone Database.
Tropical cyclone statistics
- On average, there are 10 tropical cyclones in the Australian region each season, with 3–4 making landfall.
- Since 2000, the average number each season has been closer to 8–9.
- There has always been at least one tropical cyclone that crosses the Australian coast each season.
- The first tropical cyclone to cross the Australian coast on average is in late December.
- The most tropical cyclones ever recorded in a season was 18 in 1983–84.
- The fewest tropical cyclones ever recorded in a season was 3 in 2015–16.
- The earliest tropical cyclone to cross the coast was on 21 November 1973 (Severe Tropical Cyclone Ines).
- The latest tropical cyclone to cross the coast was on 9 May 1989 (Tropical Cyclone Meena).
These statistics are based on tropical cyclone data beginning in 1980–81 and ending in 2024–25, when satellite information improved and the estimation of tropical cyclone intensity became more standardised. The exception are statistics relating to the earliest and latest cyclones to cross the coast. These are based on data beginning in 1970–71, when there is sufficient availability of required satellite observations. Most cyclones form during the official November to April season, but some form outside this peak period so these statistics use the full 12-month season from July to June.
Tropical cyclone activity by month
Tropical cyclone severity
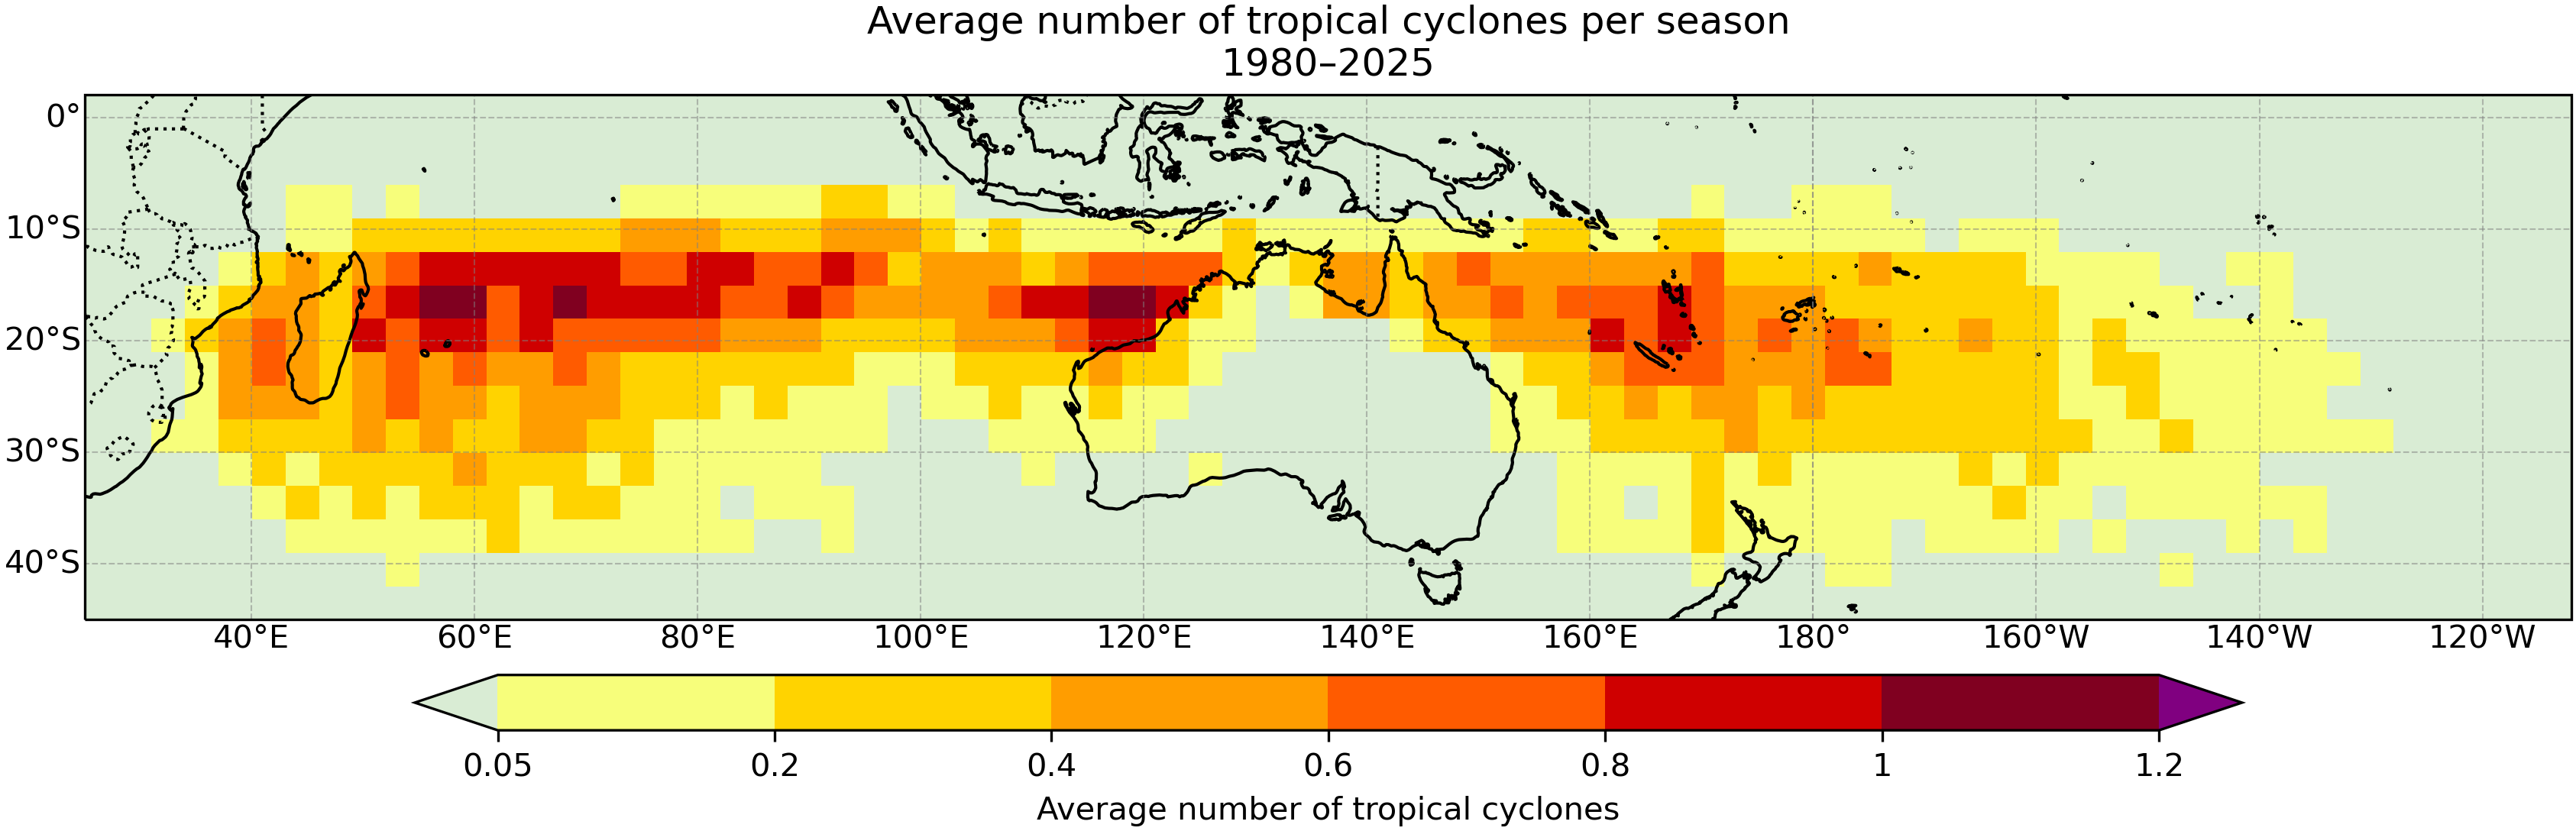
Tropical cyclone frequency map
This map shows where tropical cyclones have occurred most often, based on historical data from 1980–81 to 2024–2025. It includes out-of-season tropical cyclones (July–June).
- The map counts the number of tropical cyclones per grid cell, which is then divided by the number of years in the climatological period.
- A tropical cyclone is only counted once per grid cell.
Recent Trends
- There has been a decrease in the number of tropical cyclones observed in the Australian region (using data since 1980–81).
- The trend in cyclone intensity in the Australian region is harder to quantify than the trend in frequency, due to uncertainties in estimating the intensity of individual tropical cyclones and the relatively small number of intense tropical cyclones.
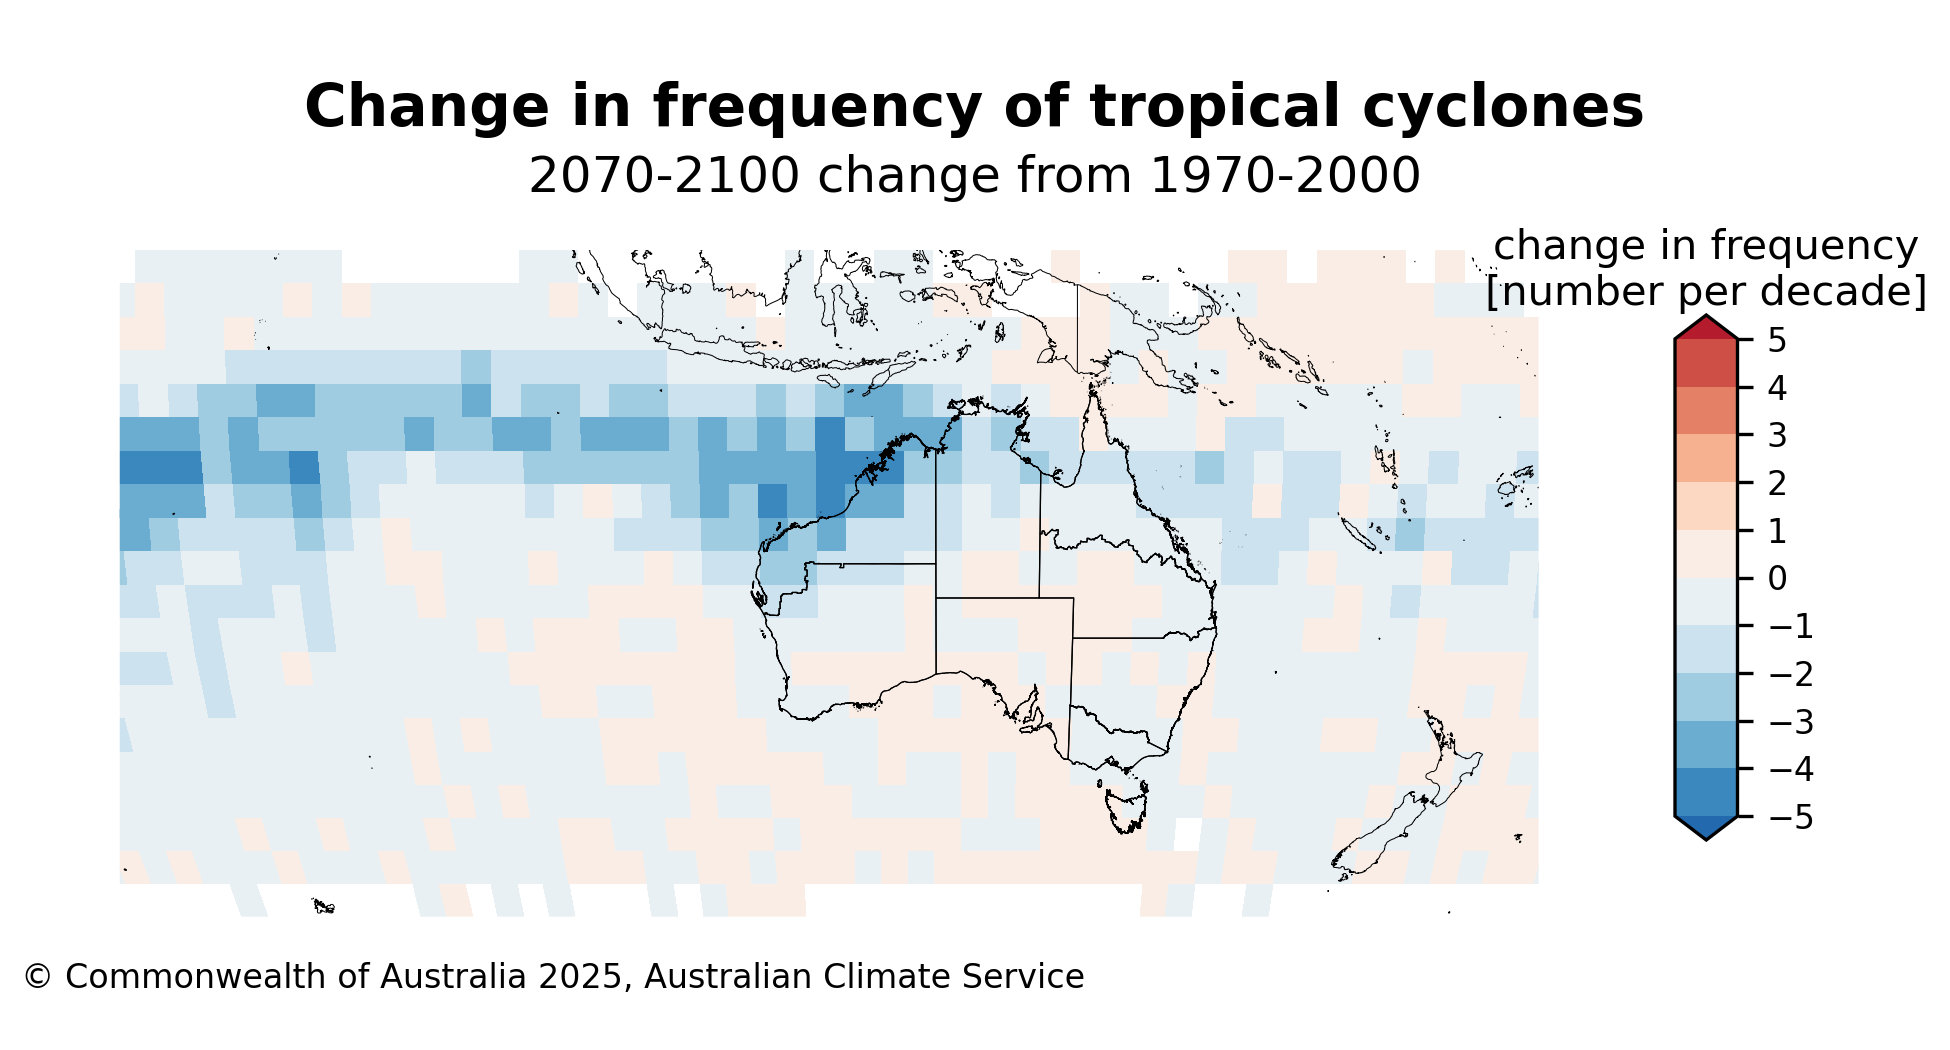
Projections
- Year-to-year variations in the number and intensity of tropical cyclones affecting Australia are large and are projected to remain so.
- Over Australia, the frequency of tropical cyclones is likely to decrease (medium confidence), but the proportion of category 4 and 5 events may increase (low/medium confidence).
- Globally, projections from published studies indicate that a bigger proportion of tropical cyclones will be of high intensity, with greater rainfall and higher storm surges due to rising sea levels (high confidence).
- Little change in position or some poleward movement of tropical cyclones is possible (low confidence).
References
- State of the Climate 2024: Bureau of Meteorology
- Hazards - Cyclones | Australian Climate Service
- Australian Climate Service 2025. Australia’s National Climate Risk Assessment Report. 280pp.
The Bureau's NEW Tropical Cyclone Knowledge Centre
Content includes:
Latest tropical reports, maps, charts and data
- Tropical Climate Update
A weekly summary of tropical conditions and outlooks including tropical cyclones, between November and April, then fortnightly in other months. - Tropical (MJO) monitoring
- SST analysis maps
- SST outlooks
- Previous season's northern wet season summary
- Previous tropical cyclone climatology maps
South Pacific
Archive of Tropical cyclone outlooks from previous seasons
Research documents
Model: Kuleshov, Y., L. Qi, R. Fawcett and D. Jones, 2008: Improving preparedness to natural hazards: Tropical cyclone prediction for the Southern Hemisphere, in Advances in Geosciences, 12 Ocean Science, (Ed. Gan, J.), World Scientific Publishing, Singapore, 127-143.
Data: Kuleshov, Y., R. Fawcett, L. Qi, B. Trewin, D. Jones, J. McBride and H. Ramsay, 2010: Trends in tropical cyclones in the South Indian Ocean and the South Pacific Ocean, Journal of Geophysical Research 115, D01101, doi:10.1029/2009JD012372.
Product code: IDCKAUTCSO
![]() Unless otherwise noted, all maps, graphs and diagrams in this page are licensed under the Creative Commons Attribution 4.0 International Licence
Unless otherwise noted, all maps, graphs and diagrams in this page are licensed under the Creative Commons Attribution 4.0 International Licence
