About the pan evaporation timeseries graphs
Analyses available
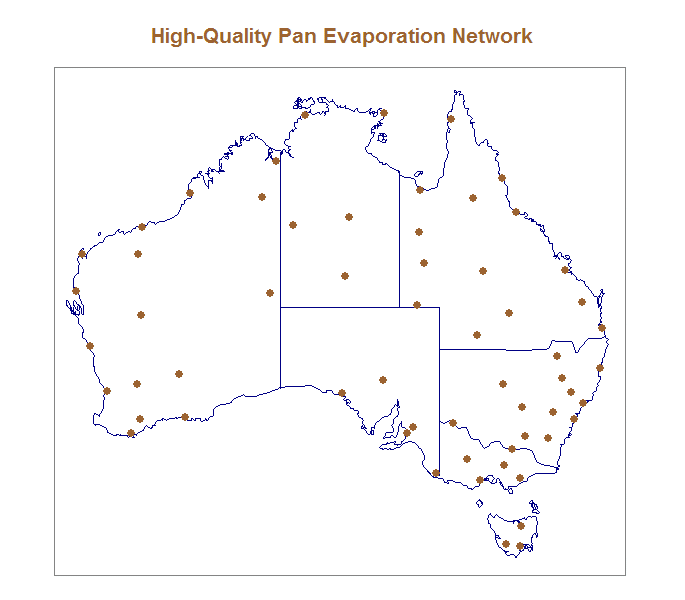
Australian and regional high-quality pan evaporation timeseries are available from 1975 for annual, seasonal and monthly evaporation totals, as well as for southern and northern wet season totals. Prior to 1970 Australia's evaporation pan network was too sparse for meaningful analyses. The size of the network increased rapidly during the early 1970s so that while only about 32 locations have high-quality evaporation data available for 1970, more than 50 locations have high-quality data available for 1975. This expansion means that the uncertainty associated with mean evaporation values is higher for years 1970 to 1974 than for later years. Consequently mean evaporation values are only shown for the relatively constant network available from 1975. Beyond 2017, due to a change in technology and a transfer to automated measurements, the number of manual pan evaporation observations have significantly reduced, preventing further analysis.
Mean evaporation values are provided for each of the seven major Australian states and territories, all of Australia, and six climatologically distinct regions; northern Australia (north of 26°S), southern Australia (south of 26°S), southwestern Australia (southwest of the line joining 30°S, 115°E and 35°S,120°E), southeastern Australia (south of 33°S, east of 135°E), eastern Australia (QLD, NSW, Victoria and Tasmania), and the Murray Darling catchment. Values calculated for NSW include the Australian Capital Territory. The graphs are plotted with a consistent range wherever possible. However, there are a small number of extreme values that exceed the graphing range. Users are referred to the data files to determine these values.

Timeseries are determined for each Australian state, the Northern Territory and the six regions shown above
Data used
Mean evaporation timeseries are calculated using a high-quality dataset corrected for discontinuities created by changes in instrumentation and location of observing sites. Due to the relatively sparse observation network, spatial averages are calculated using the method of Thiessen polygons, rather than the more complex Barnes analysis method used for other variables.
Please note that any use of these data should be acknowledged to the Bureau of Meteorology. Apart from the purposes of study, research, criticism and review, no part of these data may be reproduced, or redistributed for any commercial purposes, or distributed to a third party for such purpose, without written permission from the Director of Meteorology.
The actual data values used to produce each graph are available via the "Raw dataset" link. The format for these data is:
<start year><start month><end year><end month> <mean evaporation value (mm)>
The "Sorted dataset" link provides the timeseries as a sorted list in order to place recent values in historical context.

Locations of pan evaporation records included in spatial averages
Further information
Jovanovic, B., Jones, D.A. and Collins, D.A. 2006. A high quality monthly pan evaporation dataset for Australia. Climatic Change, 87, 517-535.


