About the pan evaporation trend maps
Analyses available
Australian and regional pan evaporation trend maps are available for annual and seasonal totals of pan evaporation, covering the period from 1970. Prior to 1970 Australia's pan evaporation network was generally too sparse for reliable analysis, and analysis periods starting after 1970 are considered too short to calculate meaningful trend values. 2017 is the last year with available pan evaporation data, as a change in technology and a transfer to automated measurements led to a significant reduction in the number of manual observations.
Interpreting the analyses
The trend maps are a useful way to compare how pan evaporation has changed in different regions of Australia over time. However, they need to be interpreted with caution. Trend values have been determined from a linear (straight line) fit to the data, but the change may not have been gradual. Also, for regions and seasons in which the year-to-year changes are large, the value of the calculated trend will depend on the start and end values of the data series, potentially misrepresenting the backgrou nd trend. Users are advised to keep in mind the period over which trend values have been calculated and interpret them alongside the timeseries of spatially averaged values.
In addition, the trend values calculated here using past observations should not be used to imply future rates of change. Due to the complex interactions between the natural and human drivers of climate change and variability, the climate of any location is always changing. Future rates of change will depend on how these drivers interact in future, which will not necessarily be the same as in the past.
Data used
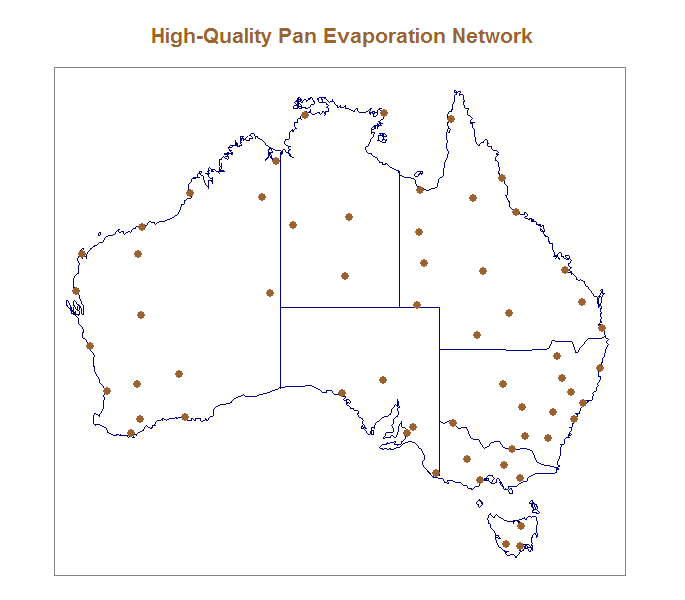
The evaporation trend maps are calculated from a "high-quality" pan evaporation dataset developed specifically for monitoring long-term trends and variability in Australian evaporation (see map below). The development of this dataset involved identifying and correcting problem records using statistical techniques, visual checks and station history information (metadata).
Please note that any use of these data should be acknowledged to the Bureau of Meteorology. Apart from the purposes of study, research, criticism and review, no part of these data may be reproduced, or redistributed for any commercial purposes, or distributed to a third party for such purpose, without written permission from the Director of Meteorology.

Locations of records included in Australia's high-quality pan evaporation dataset
Further information
Jovanovic, B., Jones, D.A. and Collins, D.A. 2006. A high-quality monthly pan evaporation dataset for Australia. Climatic Change, 87, 517-535.


