


What is La Niña and how does it impact Australia?

Issued
 PDF graphical summary of La Niña impacts in Australia, opens in new window
Australia's weather is influenced by many climate drivers. El Niño and La Niña have the strongest influence on year-to-year climate variability for most of the country. They are part of a natural cycle known as the El Niño-Southern Oscillation (ENSO). The ENSO cycle loosely operates over timescales from one to eight years.
La Niña typically means:
- Increased rainfall across much of Australia
- Cooler daytime temperatures (south of the tropics)
- Warmer overnight temperatures (in the north)
- Shift in temperature extremes
- Decreased frost risk
- Greater tropical cyclone numbers
- Earlier monsoon onset
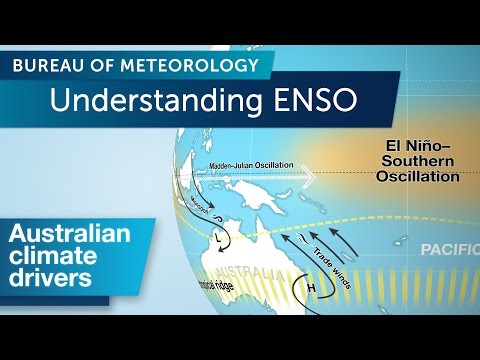 Video: Understanding ENSO
What causes La Niña?
La Niña occurs when equatorial trade winds become stronger, changing ocean surface currents and drawing cooler deep water up from below. This results in a cooling of the central and eastern tropical Pacific Ocean. The enhanced trade winds also help to pile up warm surface waters in the western Pacific and to the north of Australia.
The warming of ocean temperatures in the western Pacific means the area becomes more favourable for rising air, cloud development and rainfall. As a result, heavy rainfall can occur to the north of Australia. Conversely, over the eastern and central tropical Pacific, air descends over the cooler waters, meaning the region is less favourable for cloud and rain. The air rising in the west and descending in the east enhances an atmospheric circulation – called the Walker circulation – which can result in changes to the climate felt across the globe.
Monitoring La Niña
The term La Niña describes a particular phase of the ENSO climate cycle. ENSO is a coupled atmosphere-ocean phenomenon, which means that the transition between La Niña, El Niño and neutral conditions (neither El Niño nor La Niña) is governed by interactions between the atmosphere and ocean circulation.
In the atmosphere, ENSO is monitored via the Southern Oscillation Index (SOI), a measure of atmospheric circulation that takes the difference of atmospheric pressure between Darwin and Tahiti. In the ocean, ENSO is most commonly monitored through observed sea surface temperatures within a region of the central and eastern tropical Pacific known as NINO3.4.
El Niño and La Niña are not turned on and off like a switch. Rather, El Niño and La Niña are a function of the strength of departures from average in NINO3.4 and the SOI. This means that if conditions are close to La Niña (El Niño) thresholds, one might expect to see some La Niña-like (El Niño-like) effects on Australia.
La Niña events are typically defined when SOI values are sustained above +7 and NINO3.4 temperatures are more than −0.8 °C below average. Events that maintain index values close to these thresholds are generally classified as moderate to weak, while those that greatly exceed them are referred to as strong.
Increased rainfall
The increased rainfall and cloudiness in the western Pacific associated with La Niña usually means above-average winter–spring rainfall for Australia, particularly across the east and north.
The six wettest winter–spring periods on record for eastern Australia occurred during La Niña years. In the Murray–Darling Basin, winter–spring rainfall averaged over all 18 La Niña events (including multi-year events) since 1900 was 22% higher than the long-term average, with the severe floods of 1955, 1988, 1998 and 2010 all associated with La Niña.

Unlike El Niño years, the impacts of La Niña often continue into the warm months. In eastern Australia, the average December-March rainfall during La Niña years is 20% higher than the long-term average, with eight of the ten wettest such periods occurring during La Niña years. This is particularly notable for the east coast, which tends to be less affected by La Niña during the winter months but can experience severe flooding during La Niña summers.
The presence of La Niña increases the chance of widespread flooding. Of the 18 La Niña events since 1900 (including multi-year events), 12 have resulted in floods for some parts of Australia, with the east coast experiencing twice as many severe floods during La Niña years than El Niño years 1. Typically, some areas of northern Australia will experience flooding during La Niña because of the increase in tropical cyclone numbers.
The relationship between La Niña strength and rainfall is closely linked. The greater the sea surface temperature and SOI difference from normal, the larger the rainfall response 2. Indeed, the wettest years on record for Australia occurred during the strong 2010–2012 and 1974 La Niña events. The 2010–12 La Niña event was particularly devastating in terms of widespread flooding across Australia, although the influence of the Indian Ocean likely also increased the widespread rainfall effect.

Cooler temperatures
La Niña years tend to see cooler than average maximum temperatures across most of mainland Australia south of the tropics, particularly during the second half of the year. This is due to increased cloud cover and rainfall. However, the increased cloud cover tends to act as an insulator and results in warmer than average minimum temperatures across northern and eastern Australia during La Niña.

Shift in temperature extremes
The cooler than average daytime temperatures during La Niña years is often associated with a decreased frequency of extreme daily high temperatures.
In the warmer half of the year, southern coastal locations such as Adelaide and Melbourne experience fewer individual daily heat extremes during La Niña years but an increased frequency of prolonged warm spells. Of the 32 Victorian heatwaves between 1989 and 2009, 17 occurred during La Niña years while only 6 occurred during El Niño 3.
Due to increased cloud cover and hence warmer nights, regions of southern New South Wales and northern Victoria can experience less frost days during La Niña than the historical average 4.
Increased tropical cyclone numbers
During La Niña, there are typically more tropical cyclones in the Australia region, with twice as many making landfall than during El Niño years on average 5. The first cyclone to cross the Australian coast also tends to occur earlier in the season. The only years with multiple severe tropical cyclone landfalls in Queensland have been La Niña years 6. This means an increased likelihood of major damage and flooding related to strong winds, high seas and heavy rains from tropical cyclones.
Earlier monsoon onset
The date of the monsoon onset in tropical Australia is generally two weeks earlier during La Niña years than in El Niño years 7. This means that rainfall in the northern tropics is typically above-average during the early part of the wet season for La Niña years but only slightly above average during the latter part of the wet season.


Deeper relative snow cover
La Niña years tend to have increased snow depths in Australia's alpine regions than El Niño years, but are less reliable than neutral years 8. While La Niña usually brings above-average precipitation, temperatures can sometimes be too high and hence it may fall as rain rather than snow at high elevations, reducing snow depths. This has become more common in recent decades, with seven of the past eight La Niña years producing lower than average maximum snow depths.
Interaction with the Indian Ocean Dipole
Some La Niña events occur at the same time as a negative Indian Ocean Dipole (IOD). When they do, rainfall is above average over large parts of Australia. For example, during the strong La Niña in 2010, a negative Indian Ocean Dipole also developed, and these events combined to produce heavy rainfall and widespread flooding across eastern Australia.

Read more: IOD and ENSO interaction
Forecasting ENSO
The significant impacts that La Niña and El Niño can have across Australia and the wider globe make the ability to forecast these events important for government, agriculture, businesses and communities. Bureau seasonal forecasts include ENSO outlooks for the next several months. While the skill of these longer-range outlooks varies with the time of year, and decreases the further into the future they go, the outlooks can provide useful information about when a La Niña or El Niño is likely to occur and how long it may last.
Forecasts of the likelihood of ENSO events take into account temperature patterns across the tropical Pacific Ocean, both at the surface and in the sub-surface, variations in trade wind strength and atmospheric pressure, and ocean currents. The atmospheric and oceanic conditions are analysed by climate models designed for long-range seasonal outlooks. Ultimately, the occurrence of La Niña requires ocean and atmospheric anomalies to reinforce each other, creating a positive feedback loop which typically sustains the event for several months.
Latest and historical ENSO information
- For the latest information on the likelihood of La Niña or El Niño events, visit the Climate Driver Update and ENSO Outlook, updated every fortnight.
- For a summary of climate model outlooks for La Niña and El Niño, the Model Summary page surveys eight international models, and is updated on the 12th of every month.
- You can sign up to email alerts for all these products.
References
- 2010–11 and 2011–12 La Niña events An analysis of the La Niña life cycle and the impacts and significance of the 2010–11 and 2011–12 La Niña events in Australia
- Power S, Callaghan J. 2016. Variability in Severe Coastal Flooding, Associated Storms, and Death Tolls in Southeastern Australia since the Mid-Nineteenth Century. J. App. Met. Clim. 55, 1139–1149
- Power S, Haylock M, Colman R, Wang X. 2006. The Predictability of Interdecadal Changes in ENSO Activity and ENSO Teleconnections. J. Climate, 19, 4755–4771
- Parker T, Berry G, Reeder M, Nicholls N. 2014. Modes of climate variability and heat waves in Victoria, southeastern Australia. Geophys. Res. Lett., 41, 6926–6934
- Alexander B, Hayman P. 2008. Can we use forecasts of El Niño and La Niña for frost management in the Eastern and Southern grains belt? Proceedings of the 14th Australian Agronomy Conference, 21–25 September 2008, Adelaide, South Australia.
- Kuleshov Y, Qi L, Fawcett R, Jones D. 2008. On tropical cyclone activity in the Southern Hemisphere: Trends and the ENSO connection. Geophys. Res. Lett., 35, L14S08
- Callaghan J, Power S. 2011. Variability and decline in the number of severe tropical cyclones making land-fall over eastern Australia since the late nineteenth century. Clim Dyn, 37, 647–662
- Drosdowsky W, Wheeler M. 2014. Predicting the Onset of the North Australian Wet Season with the POAMA Dynamical Prediction System. Wea. Forecasting, 29, 150–161
- Pepler A, Trewin B, Ganter C. 2015. The influence of climate drivers on the Australian snow season. Aust. Met. and Oceano. J., 65/2, 195–205
