


For long-range forecasts of rainfall and temperature for Australia, please see our long-range forecast page. It provides the best guidance on likely conditions in the coming months, using the Bureau's climate model to take into account all influences from the oceans and atmosphere.
![]()


The Southern Hemisphere Monitoring page contains information on the broader hemispheric climate state, including the current status of the El Niño–Southern Oscillation and the Indian Ocean Dipole. This information is useful because:
- it can be a source of longer-term predictability, which can provide intelligence that extends beyond the long-range forecast period.
- understanding the long-range forecast is improved through the assessment of its consistency within the broader climate system.
Related: Southern Hemisphere Outlooks
Southern hemisphere monitoring
Pacific, Indian and Southern ocean regions
Negative Indian Ocean Dipole event underway; tropical Pacific remains cooler than average
- Since July 2024, sea surface temperatures (SSTs) in the Australian region have been the warmest or second warmest on record for each respective month. Similarly, global SSTs remain substantially above average, with September 2025 the third warmest on record.
- The sea surface temperatures (SST) analysis for the week ending 12 October 2025 shows warmer than average waters across much of the Australian region, particularly along the west and east coast. Near-average waters are present in the Great Australian Bight.
- Forecasts for November to January show warmer-than-average SSTs are likely around most of Australia, especially to the south-east.
- A negative phase of the Indian Ocean Dipole (IOD) is underway. The latest IOD index value, for the week ending 12 October 2025 is −1.39 °C.
- The Bureau's model predicts the negative IOD event to continue throughout spring, with a return to neutral in early summer. This is consistent with most international models assessed and the typical IOD life cycle.
- The El Niño–Southern Oscillation (ENSO) remains neutral. The latest relative Niño3.4 SST index value for the week ending 12 October 2025 is −0.79 °C. The two previous weeks have seen the Niño3.4 index drop below –0.8 °C. Values between –0.8 °C and +0.8 °C are considered ENSO-neutral while sustained values below –0.8 °C (for at least 3 months) are considered indicative of La Niña.
- Sub-surface waters in the central tropical Pacific have been cooler than average since July.
- Some atmospheric indicators, such as trade winds, pressure and cloud patterns over the equatorial central Pacific, show some signs of La Niña development. In contrast, the Southern Oscillation Index (SOI) is neutral as at 11 October.
- While there are signs of possible La Niña development in the ocean and atmosphere, they are not strong enough, and/or have not yet been sustained for long enough, to meet Bureau criteria for an active event.
- Under Bureau criteria, a La Niña is considered established when sustained cool waters in the central tropical Pacific (relative Niño3.4 index values below –0.8 °C for at least 3 months) are accompanied by a consistent atmospheric response.
- The Bureau's model currently predicts the tropical Pacific Ocean temperatures are likely to just meet La Niña levels during spring and early summer, before returning to neutral by the end of summer. This timing aligns with most international models assessed, although they generally show slightly more cooling, compared to the Bureau's model.
- The Southern Annular Mode (SAM) index is neutral as at 11 October. It is forecast to dip briefly to negative values in the coming week before returning to neutral conditions.
In the tropical Pacific Ocean, October sea surface temperatures (SSTs) were:
- up to 1.2 °C warmer than average in the far western tropical and far eastern equatorial Pacific Ocean
- up to 1.2 °C cooler than average in the central and eastern equatorial Pacific, east of 170°W
In Australian coastal waters, October SSTs were:
- up to 2 °C warmer than average in waters surrounding most of Australia, reaching up to 3 °C warmer than average off the north-west and south-east coasts.
Around the Maritime Continent, October SSTs were:
- up to 2 °C warmer than average
The Bureau's long-range forecast for December 2024 to February 2025 indicates SSTs are likely to be:
- up to 1.2 °C warmer than average in the far western Pacific (west of 170°E)
- close to average across most of the equatorial Pacific, east of 170°E with the exception of a small region of the equatorial Pacific between 120°E and 130°E, where it is forecast to be up to 0.8 °C cooler than average
- up to 1.2 °C warmer than average across most of Australia's coastal waters, and reaching up to 2 °C warmer in the north-west and up to 3 °C warmer in the south-east
- up to 1.2 °C warmer than average across the Maritime Continent.
ENSO and the IOD are only broad indicators of the expected climate. The long-range forecast provides better guidance on local rainfall and temperature patterns.
The equatorial Pacific sub-surface temperature anomalies for the 26 days ending 19 November 2024 show:
- cooler than average waters in the eastern half of the equatorial Pacific down to about 175 m depth; cooler waters peak around 25 to 100 m depth in the eastern Pacific where they are more than 3 °C cooler than average
- warmer than average waters in the western half of the equatorial Pacific down to about 300 m depth in the far western Pacific. Waters are 2 to 4 °C warmer than average in the far western Pacific between 75 m and 150 m depth
- generally only small changes over recent weeks with some weak warming across the basin.
Product code: IDCKGEWW00
Australian climate is influenced by sea surface temperature and atmospheric patterns in regions including the Pacific, Indian and Southern oceans. Specific regions are monitored, as they can indicate the presence, or potential development, of El Niño–Southern Oscillation (ENSO), Indian Ocean Dipole (IOD) phases and different states of the Southern Annular Mode (SAM).


About these maps
SST index regions map
The 'SST index regions' overlay map is an approximate diagram. Region boundaries are specified in 'Climate indices' below.
Sea surface temperature (SST) data
The weekly and monthly datasets are formed from weekly or monthly averages of daily SST values, and are updated either weekly or monthly in near real-time. The daily values are obtained from interpolated (gap-free) analyses on a 0.25° degree latitude by 0.25° degree longitude grid of the temperature of the uppermost 10 metres of the ocean under well-mixed conditions, based on observations from both in-water instruments and satellites. As observations are not always available within the specified time interval for all areas covered, the daily analysis systems uses 'statistical interpolation' to fill in the gaps using a weighted combination of the previous daily SST analysis and previous weekly SST analysis.
The temperature estimate is generally considered to be at approximately 0.2 metres depth (the depth of drifting buoys). However, as the observations used for the analysis have been selected for only well-mixed conditions, these temperatures are similar to temperatures down to approximately 10 metres. The maps provide SST analysis values for each 0.25° degree of latitude and longitude (approximately 28 km).
The observations used to derive the global daily SST analyses are obtained from drifting buoys, moored buoys, ships, and infrared radiometers aboard Polar-Orbiting Environmental Satellites operated by the National Oceanographic and Atmospheric Administration (NOAA) and the European Space Agency (ESA). In order to fill in some of the data gaps due to satellite infrared sensors that cannot penetrate cloud, they also incorporate SST observations from microwave sensors on polar-orbiting satellites operated by the Japan Aerospace Exploration Agency (JAXA).
- BoM GAMSSA SST analysis: Beggs et al. (2020)
- Climatology: 1991–2020 European Space Agency (ESA) SST Climate Change Initiative (CCI) Climatology product version 3.0
Climate indices
An index is a measure (often a numerical value) that can be representative of a particular pattern or state of a system. Climatologists monitor several indices, some ocean-based and some atmospheric, to provide a quick indication of the state of certain climate variables and climate indicators.
El Niño–Southern Oscillation indices
El Niño and La Niña (collectively referred to as the El Niño–Southern Oscillation or ENSO) are characterised by changes in the equatorial Pacific Ocean. During El Niño, sea surface temperatures (SST) in the central and eastern Pacific Ocean become warmer than average, while during La Niña these SSTs become cooler than average.
Niño indices regions
To monitor the Pacific Ocean for signs of El Niño or La Niña, climatologists use several SST indices. These indices measure the difference between the current sea surface temperature and its long-term (1991–2020) average in several regions located along the equatorial Pacific. The difference is referred to as an anomaly. These regions are labelled Niño1, Niño2, Niño3, Niño3.4 and Niño4 and are used by meteorological agencies around the world.
Relative Niño indices
Traditional Niño index values were used at the Bureau of Meteorology until September 2025. From September 2025, the Bureau uses Relative Niño indices, which measure sea surface temperature anomalies in the tropical Pacific Ocean in the Niño regions, but calculated relative to the global tropical region temperature anomaly. This is to relate the indices more closely to the localised processes associated with ENSO, rather than larger-scale tropical SST features such as global warming.
Example: The Relative Niño3.4 index calculation:
Relative Niño3.4 = S x [(Niño3.4obs – Niño3.4clim) – (Tropical Meanobs – Tropical Meanclim)]
Where Niño3.4obs and Tropical Meanobs are the SST averages over the Niño3.4 region and the 20°S to 20°N tropical mean SST, respectively, while Niño3.4clim and Tropical Meanclim are the climatological values for the appropriate day/month depending on the dataset. S is a scaling factor applied so the variance of the relative Niño index matches that of the traditional index.
For the analysis of ENSO status, Relative Niño indices are used in conjunction with other data, e.g., sub-surface ocean temperatures, cloudiness, winds, and the Southern Oscillation Index (SOI). Bureau climatologists cite sustained monthly Relative Niño3 or Niño3.4 index values above +0.8 °C as typical of El Niño conditions, with values of below −0.8 °C as typical of La Niña. These values are approximately one standard deviation from the long-term mean (e.g., around 70% of monthly Niño3.4 values, lie between −0.8 °C and +0.8 °C).

The Niño regions in the Pacific Ocean, are used to monitor ENSO, with Niño3 and Niño3.4 typically used to identify El Niño and La Niña.
Niño regions cover the following areas:
- Niño1 (far eastern equatorial Pacific): 5–10°S, 90–80°W
- Niño2 (far eastern equatorial Pacific): 0–5°S, 90–80°W
- Niño3 (eastern equatorial Pacific): 5°N–5°S, 150–90°W
- Niño3.4 (central equatorial Pacific): 5°N–5°S, 170–120°W
- Niño4 (western equatorial Pacific): 5°N–5°S, 160°E–150°W
For monitoring of ENSO phases, the value of the Niño indices are often used in conjunction with other data, e.g., sub-surface ocean temperatures, cloudiness, winds, and the Southern Oscillation Index (SOI). The Bureau cites sustained monthly Niño3 or Niño3.4 values above +0.8 °C as being associated with El Niño, and values below −0.8 °C being associated with La Niña. These values are approximately one standard deviation from the long-term mean (i.e., around 70% of monthly Niño3 values in the historical record, for example, lie between −0.8 °C and +0.8 °C).
Southern Oscillation Index (SOI)
The Southern Oscillation Index, or SOI, gives an indication of the state and intensity of ENSO, from an atmospheric perspective. The SOI is calculated using the pressure differences between Tahiti and Darwin.
Sustained negative values of the SOI below −7 often indicate El Niño is active while sustained positive values above +7 are typical of a La Niña.
Technical details
There are a few different methods for calculating the SOI. The method used by the Australian Bureau of Meteorology is the Troup SOI which is the standardised anomaly of the Mean Sea Level Pressure difference between Tahiti and Darwin. The base period used in the SOI calculation is 60 years (1933–1992).
Calculation
                        Pdiff − Pdiffav
            SOI = 10 x -------------------,
                            SD(Pdiff)
where:
Pdiff = (average Tahiti MSLP for the period) − (average Darwin MSLP for the period),
Pdiffav = long term average of Pdiff for the period in question, and
SD(Pdiff) = long term standard deviation of Pdiff for the period in question.
The multiplication by 10 is a convention to make the final value more readable. Using this convention, the SOI ranges from about –35 to about +35, and the value of the SOI can be quoted as a whole number. The SOI is usually computed on a monthly basis, with values over longer periods such a three-month average being sometimes used. Daily values can also be averaged over a longer period to form a multi-day average. Single-day or weekly values of the SOI are not so useful for information on the current state of the climate, as these values are dominated by the effects of short-term weather variability, and accordingly the Bureau of Meteorology does not issue them. In particular, single-day values can fluctuate markedly because of daily weather patterns, and should not be used for climate purposes.
The Indian Ocean Dipole index
Indian Ocean Dipole (IOD) phases are driven by changes in the tropical Indian Ocean. Sustained changes in the difference between normal sea surface temperatures in the tropical western and eastern Indian Ocean are what characterise IOD phases.
The IOD is commonly measured by an index (sometimes referred to as the Dipole Mode Index, or DMI) that is the difference between SST anomalies in two regions of the tropical Indian Ocean (see map):
IOD regions:
- IOD west: 50°E to 70°E and 10°S to 10°N
- IOD east: 90°E to 110°E and 10°S to 0°S
A positive IOD period is characterised by cooler than average water in the tropical eastern Indian Ocean and warmer than average water in the tropical western Indian Ocean. Conversely, a negative IOD period is characterised by warmer than average water in the tropical eastern Indian Ocean and cooler than average water in the tropical western Indian Ocean.
For monitoring the IOD, Australian climatologists consider sustained values above +0.4 °C as typical of a positive IOD, and values below −0.4 °C as typical of a negative IOD.
- Details about:
- IOD
- IOD phases
The Southern Annular Mode index
The Southern Annular Mode, or SAM, refers to the north-south movement of rain-bearing westerly winds and weather systems in the Southern Ocean, compared to the usual seasonal position. A positive SAM refers to a southward shift while a negative SAM refers to an northward shift. The typical impact on Australian rainfall from positive and negative phases of SAM depends on the time of year and interaction with other climate indicators such as El Niño or La Niña.
Sustained values of the SAM index above +1 indicate a positive SAM event, while sustained values below -1 indicate a negative SAM event.
SAM reasearch paper: Southern annular mode impacts on global ocean surface waves.
- Details about:
- About SAM
About the data
Data periods
Daily datasets have a value for every day in their record. Similarly, weekly and monthly (30 day) data sets have values for every week or month (30 days), respectively, in their record.
Sea surface temperature data
The weekly and monthly datasets are formed from weekly or monthly averages of daily SST values, and are updated either weekly or monthly in near real-time. The daily values are obtained from interpolated (gap-free) analyses on a 0.25° latitude by 0.25° longitude grid of the temperature of the uppermost 10 metres of the ocean under well-mixed conditions, based on observations from both in-water instruments and satellites. As observations are not always available within the specified time interval for all areas covered, the daily analysis systems uses 'statistical interpolation' to fill in the gaps using a weighted combination of the previous daily SST analysis and previous weekly SST analysis.
The temperature estimate is generally considered to be at approximately 0.2 metres depth (the depth of drifting buoys). However, as the observations used for the analysis have been selected for only well-mixed conditions, these temperatures are similar to temperatures down to approximately 10 metres. The maps provide SST analysis values for each 0.25° of latitude and longitude (approximately 28 km).
The observations used to derive the global daily SST analyses are obtained from drifting buoys, moored buoys, ships, and infrared radiometers aboard Polar-Orbiting Environmental Satellites operated by the National Oceanographic and Atmospheric Administration (NOAA) and the European Space Agency (ESA). In order to fill in some of the data gaps due to satellite infrared sensors that cannot penetrate cloud, they also incorporate SST observations from microwave sensors on polar-orbiting satellites operated by the Japan Aerospace Exploration Agency (JAXA).
- BoM GAMSSA SST analysis: Beggs et al. (2011) and Beggs et al. (2020)
- Climatology: 1991–2020 European Space Agency (ESA) SST Climate Change Initiative (CCI) Climatology product version 3.0
Early SST data
Before the satellite era (which began in the early 1980s), the primary source of SST data was observations made by ships passing through the region. The frequency of these observations was too low to produce a useful weekly dataset, so it is shorter than the monthly dataset. IOD and ENSO event identification using early SST data has limited accuracy, particularly for the Indian Ocean.
SOI data
Data source: The Bureau maintains a SOI database.
The SOI data includes a long history of monthly pressure readings from Darwin and Tahiti that have been digitised for electronic use. Old daily pressure readings have not yet been digitised, so a shorter dataset is available.
Australian climate is influenced by sea surface temperature and atmospheric patterns in regions including the Pacific, Indian and Southern oceans. Specific regions are monitored, as they can indicate the presence, or potential development, of El Niño–Southern Oscillation (ENSO), Indian Ocean Dipole (IOD) phases and different states of the Southern Annular Mode (SAM).
Climate index monitoring graphs
The Relative Niño indices (R-Niño) are the Bureau of Meteorology's operational indices for monitoring the oceanic component of the El Nino-Southern Oscillation. Prior to September 2025, the Traditional Niño indices (T-Niño) were used. See 'About these graphs' (below the graphs) for more information. The T-Niño index values are included for comparison and archival purposes.
Graph
About these graphs
Climate indices
An index is a measure (often a numerical value) that can be representative of a particular pattern or state of a system. Climatologists monitor several indices, some ocean-based and some atmospheric, to provide a quick indication of the state of certain climate variables and climate indicators.
El Niño–Southern Oscillation indices
El Niño and La Niña (collectively referred to as the El Niño–Southern Oscillation or ENSO) are characterised by changes in the equatorial Pacific Ocean. During El Niño, sea surface temperatures (SST) in the central and eastern Pacific Ocean become warmer than average, while during La Niña these SSTs become cooler than average.
Niño indices regions
To monitor the Pacific Ocean for signs of El Niño or La Niña, climatologists use several SST indices. These indices measure the difference between the current sea surface temperature and its long-term (1991–2020) average in several regions located along the equatorial Pacific. The difference is referred to as an anomaly. These regions are labelled Niño1, Niño2, Niño3, Niño3.4 and Niño4 and are used by meteorological agencies around the world.
Relative Niño indices
Traditional Niño index values were used at the Bureau of Meteorology until September 2025. From September 2025, the Bureau uses Relative Niño indices, which measure sea surface temperature anomalies in the tropical Pacific Ocean in the Niño regions, but calculated relative to the global tropical region temperature anomaly. This is to relate the indices more closely to the localised processes associated with ENSO, rather than larger-scale tropical SST features such as global warming.
Example: The Relative Niño3.4 index calculation:
Relative Niño3.4 = S x [(Niño3.4obs – Niño3.4clim) – (Tropical Meanobs – Tropical Meanclim)]
Where Niño3.4obs and Tropical Meanobs are the SST averages over the Niño3.4 region and the 20°S to 20°N tropical mean SST, respectively, while Niño3.4clim and Tropical Meanclim are the climatological values for the appropriate day/month depending on the dataset. S is a scaling factor applied so the variance of the relative Niño index matches that of the traditional index.
For the analysis of ENSO status, Relative Niño indices are used in conjunction with other data, e.g., sub-surface ocean temperatures, cloudiness, winds, and the Southern Oscillation Index (SOI). Bureau climatologists cite sustained monthly Relative Niño3 or Niño3.4 index values above +0.8 °C as typical of El Niño conditions, with values of below −0.8 °C as typical of La Niña. These values are approximately one standard deviation from the long-term mean (e.g., around 70% of monthly Niño3.4 values, lie between −0.8 °C and +0.8 °C).
The Niño regions in the Pacific Ocean, are used to monitor ENSO, with Niño3 and Niño3.4 typically used to identify El Niño and La Niña.
Niño regions cover the following areas:
- Niño1 (far eastern equatorial Pacific): 5–10°S, 90–80°W
- Niño2 (far eastern equatorial Pacific): 0–5°S, 90–80°W
- Niño3 (eastern equatorial Pacific): 5°N–5°S, 150–90°W
- Niño3.4 (central equatorial Pacific): 5°N–5°S, 170–120°W
- Niño4 (western equatorial Pacific): 5°N–5°S, 160°E–150°W
For monitoring of ENSO phases, the value of the Niño indices are often used in conjunction with other data, e.g., sub-surface ocean temperatures, cloudiness, winds, and the Southern Oscillation Index (SOI). The Bureau cites sustained monthly Niño3 or Niño3.4 values above +0.8 °C as being associated with El Niño, and values below −0.8 °C being associated with La Niña. These values are approximately one standard deviation from the long-term mean (i.e., around 70% of monthly Niño3 values in the historical record, for example, lie between −0.8 °C and +0.8 °C).
Southern Oscillation Index (SOI)
The Southern Oscillation Index, or SOI, gives an indication of the state and intensity of ENSO, from an atmospheric perspective. The SOI is calculated using the pressure differences between Tahiti and Darwin.
Sustained negative values of the SOI below −7 often indicate El Niño is active while sustained positive values above +7 are typical of a La Niña.
Technical details
There are a few different methods for calculating the SOI. The method used by the Australian Bureau of Meteorology is the Troup SOI which is the standardised anomaly of the Mean Sea Level Pressure difference between Tahiti and Darwin. The base period used in the SOI calculation is 60 years (1933–1992).
Calculation
                        Pdiff − Pdiffav
            SOI = 10 x -------------------,
                            SD(Pdiff)
where:
Pdiff = (average Tahiti MSLP for the period) − (average Darwin MSLP for the period),
Pdiffav = long term average of Pdiff for the period in question, and
SD(Pdiff) = long term standard deviation of Pdiff for the period in question.
The multiplication by 10 is a convention to make the final value more readable. Using this convention, the SOI ranges from about –35 to about +35, and the value of the SOI can be quoted as a whole number. The SOI is usually computed on a monthly basis, with values over longer periods such a three-month average being sometimes used. Daily values can also be averaged over a longer period to form a multi-day average. Single-day or weekly values of the SOI are not so useful for information on the current state of the climate, as these values are dominated by the effects of short-term weather variability, and accordingly the Bureau of Meteorology does not issue them. In particular, single-day values can fluctuate markedly because of daily weather patterns, and should not be used for climate purposes.
The Indian Ocean Dipole index
Indian Ocean Dipole (IOD) phases are driven by changes in the tropical Indian Ocean. Sustained changes in the difference between normal sea surface temperatures in the tropical western and eastern Indian Ocean are what characterise IOD phases.
The IOD is commonly measured by an index (sometimes referred to as the Dipole Mode Index, or DMI) that is the difference between SST anomalies in two regions of the tropical Indian Ocean (see map):
IOD regions:
- IOD west: 50°E to 70°E and 10°S to 10°N
- IOD east: 90°E to 110°E and 10°S to 0°S
A positive IOD period is characterised by cooler than average water in the tropical eastern Indian Ocean and warmer than average water in the tropical western Indian Ocean. Conversely, a negative IOD period is characterised by warmer than average water in the tropical eastern Indian Ocean and cooler than average water in the tropical western Indian Ocean.
For monitoring the IOD, Australian climatologists consider sustained values above +0.4 °C as typical of a positive IOD, and values below −0.4 °C as typical of a negative IOD.
- Details about:
- IOD
- IOD phases
The Southern Annular Mode index
The Southern Annular Mode, or SAM, refers to the north-south movement of rain-bearing westerly winds and weather systems in the Southern Ocean, compared to the usual seasonal position. A positive SAM refers to a southward shift while a negative SAM refers to an northward shift. The typical impact on Australian rainfall from positive and negative phases of SAM depends on the time of year and interaction with other climate indicators such as El Niño or La Niña.
Sustained values of the SAM index above +1 indicate a positive SAM event, while sustained values below -1 indicate a negative SAM event.
SAM reasearch paper: Southern annular mode impacts on global ocean surface waves.
- Details about:
- About SAM
About the data
Data periods
Daily datasets have a value for every day in their record. Similarly, weekly and monthly (30 day) data sets have values for every week or month (30 days), respectively, in their record.
Sea surface temperature data
The weekly and monthly datasets are formed from weekly or monthly averages of daily SST values, and are updated either weekly or monthly in near real-time. The daily values are obtained from interpolated (gap-free) analyses on a 0.25° latitude by 0.25° longitude grid of the temperature of the uppermost 10 metres of the ocean under well-mixed conditions, based on observations from both in-water instruments and satellites. As observations are not always available within the specified time interval for all areas covered, the daily analysis systems uses 'statistical interpolation' to fill in the gaps using a weighted combination of the previous daily SST analysis and previous weekly SST analysis.
The temperature estimate is generally considered to be at approximately 0.2 metres depth (the depth of drifting buoys). However, as the observations used for the analysis have been selected for only well-mixed conditions, these temperatures are similar to temperatures down to approximately 10 metres. The maps provide SST analysis values for each 0.25° of latitude and longitude (approximately 28 km).
The observations used to derive the global daily SST analyses are obtained from drifting buoys, moored buoys, ships, and infrared radiometers aboard Polar-Orbiting Environmental Satellites operated by the National Oceanographic and Atmospheric Administration (NOAA) and the European Space Agency (ESA). In order to fill in some of the data gaps due to satellite infrared sensors that cannot penetrate cloud, they also incorporate SST observations from microwave sensors on polar-orbiting satellites operated by the Japan Aerospace Exploration Agency (JAXA).
- BoM GAMSSA SST analysis: Beggs et al. (2011) and Beggs et al. (2020)
- Climatology: 1991–2020 European Space Agency (ESA) SST Climate Change Initiative (CCI) Climatology product version 3.0
Early SST data
Before the satellite era (which began in the early 1980s), the primary source of SST data was observations made by ships passing through the region. The frequency of these observations was too low to produce a useful weekly dataset, so it is shorter than the monthly dataset. IOD and ENSO event identification using early SST data has limited accuracy, particularly for the Indian Ocean.
SOI data
Data source: The Bureau maintains a SOI database.
The SOI data includes a long history of monthly pressure readings from Darwin and Tahiti that have been digitised for electronic use. Old daily pressure readings have not yet been digitised, so a shorter dataset is available.
The Pacific Ocean is monitored closely for the current state of the El Niño–Southern Oscillation (ENSO). ENSO refers to the oscillation between warmer (El Niño) and cooler (La Niña) states of the central and eastern tropical Pacific region. ENSO is considered one of the dominant modes of climate variability in Australia. The influence of each individual event varies, particularly in conjunction with other climate indicators such as the Indian Ocean Dipole (IOD).
The ENSO signal is characterised by sea surface temperature (SST) patterns in the central and eastern tropical Pacific. Cooler than average SSTs are associated with La Niña, while warmer SSTs are associated with El Niño.
Pacific Ocean
Weekly and monthly sea surface temperature

- See also: Links open in new window
- Animation of recent SST changes
Relative Niño indices

About these graphs
Climate indices
An index is a measure (often a numerical value) that can be representative of a particular pattern or state of a system. Climatologists monitor several indices, some ocean-based and some atmospheric, to provide a quick indication of the state of certain climate variables and climate indicators.
El Niño–Southern Oscillation indices
El Niño and La Niña (collectively referred to as the El Niño–Southern Oscillation or ENSO) are characterised by changes in the equatorial Pacific Ocean. During El Niño, sea surface temperatures (SST) in the central and eastern Pacific Ocean become warmer than average, while during La Niña these SSTs become cooler than average.
Niño indices regions
To monitor the Pacific Ocean for signs of El Niño or La Niña, climatologists use several SST indices. These indices measure the difference between the current sea surface temperature and its long-term (1991–2020) average in several regions located along the equatorial Pacific. The difference is referred to as an anomaly. These regions are labelled Niño1, Niño2, Niño3, Niño3.4 and Niño4 and are used by meteorological agencies around the world.
Relative Niño indices
Traditional Niño index values were used at the Bureau of Meteorology until September 2025. From September 2025, the Bureau uses Relative Niño indices, which measure sea surface temperature anomalies in the tropical Pacific Ocean in the Niño regions, but calculated relative to the global tropical region temperature anomaly. This is to relate the indices more closely to the localised processes associated with ENSO, rather than larger-scale tropical SST features such as global warming.
Example: The Relative Niño3.4 index calculation:
Relative Niño3.4 = S x [(Niño3.4obs – Niño3.4clim) – (Tropical Meanobs – Tropical Meanclim)]
Where Niño3.4obs and Tropical Meanobs are the SST averages over the Niño3.4 region and the 20°S to 20°N tropical mean SST, respectively, while Niño3.4clim and Tropical Meanclim are the climatological values for the appropriate day/month depending on the dataset. S is a scaling factor applied so the variance of the relative Niño index matches that of the traditional index.
For the analysis of ENSO status, Relative Niño indices are used in conjunction with other data, e.g., sub-surface ocean temperatures, cloudiness, winds, and the Southern Oscillation Index (SOI). Bureau climatologists cite sustained monthly Relative Niño3 or Niño3.4 index values above +0.8 °C as typical of El Niño conditions, with values of below −0.8 °C as typical of La Niña. These values are approximately one standard deviation from the long-term mean (e.g., around 70% of monthly Niño3.4 values, lie between −0.8 °C and +0.8 °C).
The Niño regions in the Pacific Ocean, are used to monitor ENSO, with Niño3 and Niño3.4 typically used to identify El Niño and La Niña.
Niño regions cover the following areas:
- Niño1 (far eastern equatorial Pacific): 5–10°S, 90–80°W
- Niño2 (far eastern equatorial Pacific): 0–5°S, 90–80°W
- Niño3 (eastern equatorial Pacific): 5°N–5°S, 150–90°W
- Niño3.4 (central equatorial Pacific): 5°N–5°S, 170–120°W
- Niño4 (western equatorial Pacific): 5°N–5°S, 160°E–150°W
For monitoring of ENSO phases, the value of the Niño indices are often used in conjunction with other data, e.g., sub-surface ocean temperatures, cloudiness, winds, and the Southern Oscillation Index (SOI). The Bureau cites sustained monthly Niño3 or Niño3.4 values above +0.8 °C as being associated with El Niño, and values below −0.8 °C being associated with La Niña. These values are approximately one standard deviation from the long-term mean (i.e., around 70% of monthly Niño3 values in the historical record, for example, lie between −0.8 °C and +0.8 °C).
Southern Oscillation Index (SOI)
The Southern Oscillation Index, or SOI, gives an indication of the state and intensity of ENSO, from an atmospheric perspective. The SOI is calculated using the pressure differences between Tahiti and Darwin.
Sustained negative values of the SOI below −7 often indicate El Niño is active while sustained positive values above +7 are typical of a La Niña.
Technical details
There are a few different methods for calculating the SOI. The method used by the Australian Bureau of Meteorology is the Troup SOI which is the standardised anomaly of the Mean Sea Level Pressure difference between Tahiti and Darwin. The base period used in the SOI calculation is 60 years (1933–1992).
Calculation
                        Pdiff − Pdiffav
            SOI = 10 x -------------------,
                            SD(Pdiff)
where:
Pdiff = (average Tahiti MSLP for the period) − (average Darwin MSLP for the period),
Pdiffav = long term average of Pdiff for the period in question, and
SD(Pdiff) = long term standard deviation of Pdiff for the period in question.
The multiplication by 10 is a convention to make the final value more readable. Using this convention, the SOI ranges from about –35 to about +35, and the value of the SOI can be quoted as a whole number. The SOI is usually computed on a monthly basis, with values over longer periods such a three-month average being sometimes used. Daily values can also be averaged over a longer period to form a multi-day average. Single-day or weekly values of the SOI are not so useful for information on the current state of the climate, as these values are dominated by the effects of short-term weather variability, and accordingly the Bureau of Meteorology does not issue them. In particular, single-day values can fluctuate markedly because of daily weather patterns, and should not be used for climate purposes.
The Indian Ocean Dipole index
Indian Ocean Dipole (IOD) phases are driven by changes in the tropical Indian Ocean. Sustained changes in the difference between normal sea surface temperatures in the tropical western and eastern Indian Ocean are what characterise IOD phases.
The IOD is commonly measured by an index (sometimes referred to as the Dipole Mode Index, or DMI) that is the difference between SST anomalies in two regions of the tropical Indian Ocean (see map):
IOD regions:
- IOD west: 50°E to 70°E and 10°S to 10°N
- IOD east: 90°E to 110°E and 10°S to 0°S
A positive IOD period is characterised by cooler than average water in the tropical eastern Indian Ocean and warmer than average water in the tropical western Indian Ocean. Conversely, a negative IOD period is characterised by warmer than average water in the tropical eastern Indian Ocean and cooler than average water in the tropical western Indian Ocean.
For monitoring the IOD, Australian climatologists consider sustained values above +0.4 °C as typical of a positive IOD, and values below −0.4 °C as typical of a negative IOD.
- Details about:
- IOD
- IOD phases
The Southern Annular Mode index
The Southern Annular Mode, or SAM, refers to the north-south movement of rain-bearing westerly winds and weather systems in the Southern Ocean, compared to the usual seasonal position. A positive SAM refers to a southward shift while a negative SAM refers to an northward shift. The typical impact on Australian rainfall from positive and negative phases of SAM depends on the time of year and interaction with other climate indicators such as El Niño or La Niña.
Sustained values of the SAM index above +1 indicate a positive SAM event, while sustained values below -1 indicate a negative SAM event.
SAM reasearch paper: Southern annular mode impacts on global ocean surface waves.
- Details about:
- About SAM
About the data
Data periods
Daily datasets have a value for every day in their record. Similarly, weekly and monthly (30 day) data sets have values for every week or month (30 days), respectively, in their record.
Sea surface temperature data
The weekly and monthly datasets are formed from weekly or monthly averages of daily SST values, and are updated either weekly or monthly in near real-time. The daily values are obtained from interpolated (gap-free) analyses on a 0.25° latitude by 0.25° longitude grid of the temperature of the uppermost 10 metres of the ocean under well-mixed conditions, based on observations from both in-water instruments and satellites. As observations are not always available within the specified time interval for all areas covered, the daily analysis systems uses 'statistical interpolation' to fill in the gaps using a weighted combination of the previous daily SST analysis and previous weekly SST analysis.
The temperature estimate is generally considered to be at approximately 0.2 metres depth (the depth of drifting buoys). However, as the observations used for the analysis have been selected for only well-mixed conditions, these temperatures are similar to temperatures down to approximately 10 metres. The maps provide SST analysis values for each 0.25° of latitude and longitude (approximately 28 km).
The observations used to derive the global daily SST analyses are obtained from drifting buoys, moored buoys, ships, and infrared radiometers aboard Polar-Orbiting Environmental Satellites operated by the National Oceanographic and Atmospheric Administration (NOAA) and the European Space Agency (ESA). In order to fill in some of the data gaps due to satellite infrared sensors that cannot penetrate cloud, they also incorporate SST observations from microwave sensors on polar-orbiting satellites operated by the Japan Aerospace Exploration Agency (JAXA).
- BoM GAMSSA SST analysis: Beggs et al. (2011) and Beggs et al. (2020)
- Climatology: 1991–2020 European Space Agency (ESA) SST Climate Change Initiative (CCI) Climatology product version 3.0
Early SST data
Before the satellite era (which began in the early 1980s), the primary source of SST data was observations made by ships passing through the region. The frequency of these observations was too low to produce a useful weekly dataset, so it is shorter than the monthly dataset. IOD and ENSO event identification using early SST data has limited accuracy, particularly for the Indian Ocean.
SOI data
Data source: The Bureau maintains a SOI database.
The SOI data includes a long history of monthly pressure readings from Darwin and Tahiti that have been digitised for electronic use. Old daily pressure readings have not yet been digitised, so a shorter dataset is available.
- See also: Links open in new window
- Monthly SOI graph
Cooler than average waters beneath the surface of the central and eastern tropical Pacific can be a sign of La Niña development, while warmer than average waters can be a sign of El Niño development.
5-day and monthly sub-surface temperatures


The Southern Oscillation Index (SOI) refers to the difference in mean sea level pressure (MSLP) anomalies between Tahiti and Darwin. Sustained positive values of the SOI above +7 typically indicate La Niña and represent lower than average MSLP at Darwin and/or higher than average MSLP at Tahiti. Sustained negative values below −7 typically indicate El Niño, and higher than average MSLP at Darwin and/or lower than average MSLP at Tahiti.
Southern Oscillation Index

About these graphs
Climate indices
An index is a measure (often a numerical value) that can be representative of a particular pattern or state of a system. Climatologists monitor several indices, some ocean-based and some atmospheric, to provide a quick indication of the state of certain climate variables and climate indicators.
El Niño–Southern Oscillation indices
El Niño and La Niña (collectively referred to as the El Niño–Southern Oscillation or ENSO) are characterised by changes in the equatorial Pacific Ocean. During El Niño, sea surface temperatures (SST) in the central and eastern Pacific Ocean become warmer than average, while during La Niña these SSTs become cooler than average.
Niño indices regions
To monitor the Pacific Ocean for signs of El Niño or La Niña, climatologists use several SST indices. These indices measure the difference between the current sea surface temperature and its long-term (1991–2020) average in several regions located along the equatorial Pacific. The difference is referred to as an anomaly. These regions are labelled Niño1, Niño2, Niño3, Niño3.4 and Niño4 and are used by meteorological agencies around the world.
The Niño regions in the Pacific Ocean, are used to monitor ENSO, with Niño3 and Niño3.4 typically used to identify El Niño and La Niña.
Niño regions cover the following areas:
- Niño1 (far eastern equatorial Pacific): 5–10°S, 80–90°W
- Niño2 (far eastern equatorial Pacific): 0–5°S, 80–90°W
- Niño3 (eastern equatorial Pacific): 5°N–5°S, 150–90°W
- Niño3.4 (central equatorial Pacific): 5°N–5°S, 120–170°W
- Niño4 (western equatorial Pacific): 5°N–5°S, 160°E–150°W
For monitoring of ENSO phases, the value of the Niño indices are often used in conjunction with other data, e.g., sub-surface ocean temperatures, cloudiness, winds, and the Southern Oscillation Index (SOI). The Bureau cites sustained monthly Niño3 or Niño3.4 values above +0.8 °C as being associated with El Niño, and values below −0.8 °C being associated with La Niña. These values are approximately one standard deviation from the long-term mean (i.e., around 70% of monthly Niño3 values in the historical record, for example, lie between −0.8 °C and +0.8 °C).
Southern Oscillation Index (SOI)
The Southern Oscillation Index, or SOI, gives an indication of the state and intensity of ENSO, from an atmospheric perspective. The SOI is calculated using the pressure differences between Tahiti and Darwin.
Sustained negative values of the SOI below −7 often indicate El Niño is active while sustained positive values above +7 are typical of a La Niña.
Early monthly pressure readings from Darwin and Tahiti have been digitised for electronic use. Early daily pressure readings have not yet been digitised, so a shorter dataset is available.
Technical details
There are a few different methods for calculating the SOI. The method used by the Australian Bureau of Meteorology is the Troup SOI which is the standardised anomaly of the Mean Sea Level Pressure difference between Tahiti and Darwin. The base period used in the SOI calculation is 60 years (1933–1992).
Calculation
                        Pdiff − Pdiffav
            SOI = 10 x -------------------,
                            SD(Pdiff)
where:
Pdiff = (average Tahiti MSLP for the period) − (average Darwin MSLP for the period),
Pdiffav = long term average of Pdiff for the period in question, and
SD(Pdiff) = long term standard deviation of Pdiff for the period in question.
The multiplication by 10 is a convention to make the final value more readable. Using this convention, the SOI ranges from about –35 to about +35, and the value of the SOI can be quoted as a whole number. The SOI is usually computed on a monthly basis, with values over longer periods such a year being sometimes used. Daily values can also be averaged over a longer period to form a multi-day average. Single-day or weekly values of the SOI are not so useful for information on the current state of the climate, as these values are dominated by the effects of short-term weather variability, and accordingly the Bureau of Meteorology does not issue them. In particular, single-day values can fluctuate markedly because of daily weather patterns, and should not be used for climate purposes.
- Details about:
- About ENSO, El Niño and La Niña
- SOI
The Indian Ocean Dipole index
Indian Ocean Dipole (IOD) phases are driven by changes in the tropical Indian Ocean. Sustained changes in the difference between normal sea surface temperatures in the tropical western and eastern Indian Ocean are what characterise IOD phases.
The IOD is commonly measured by an index (sometimes referred to as the Dipole Mode Index, or DMI) that is the difference between SST anomalies in two regions of the tropical Indian Ocean (see map):
IOD regions:
- IOD west: 50°E to 70°E and 10°S to 10°N
- IOD east: 90°E to 110°E and 10°S to 0°S
A positive IOD period is characterised by cooler than average water in the tropical eastern Indian Ocean and warmer than average water in the tropical western Indian Ocean. Conversely, a negative IOD period is characterised by warmer than average water in the tropical eastern Indian Ocean and cooler than average water in the tropical western Indian Ocean.
For monitoring the IOD, Australian climatologists consider sustained values above +0.4 °C as typical of a positive IOD, and values below −0.4 °C as typical of a negative IOD.
- Details about:
- IOD
- IOD phases
The Southern Annular Mode index
The Southern Annular Mode, or SAM, refers to the north-south movement of rain-bearing westerly winds and weather systems in the Southern Ocean, compared to the usual seasonal position. A positive SAM refers to a southward shift while a negative SAM refers to an northward shift. The typical impact on Australian rainfall from positive and negative phases of SAM depends on the time of year and interaction with other climate indicators such as El Niño or La Niña.
Sustained values of the SAM index above +1 indicate a positive SAM event, while sustained values below -1 indicate a negative SAM event.
- Details about:
- About SAM
About the data
Data periods
Daily datasets have a value for every day in their record. Similarly, weekly and monthly (30 day) data sets have values for every week or month (30 days), respectively, in their record.
Sea surface temperature data
The weekly and monthly datasets are formed from weekly or monthly averages of daily SST values, and are updated either weekly or monthly in near real-time. The daily values are obtained from interpolated (gap-free) analyses on a 0.25° latitude by 0.25° longitude grid of the temperature of the uppermost 10 metres of the ocean under well-mixed conditions, based on observations from both in-water instruments and satellites. As observations are not always available within the specified time interval for all areas covered, the daily analysis systems uses 'statistical interpolation' to fill in the gaps using a weighted combination of the previous daily SST analysis and previous weekly SST analysis.
The temperature estimate is generally considered to be at approximately 0.2 metres depth (the depth of drifting buoys). However, as the observations used for the analysis have been selected for only well-mixed conditions, these temperatures are similar to temperatures down to approximately 10 metres. The maps provide SST analysis values for each 0.25° of latitude and longitude (approximately 28 km).
The observations used to derive the global daily SST analyses are obtained from drifting buoys, moored buoys, ships, and infrared radiometers aboard Polar-Orbiting Environmental Satellites operated by the National Oceanographic and Atmospheric Administration (NOAA) and the European Space Agency (ESA). In order to fill in some of the data gaps due to satellite infrared sensors that cannot penetrate cloud, they also incorporate SST observations from microwave sensors on polar-orbiting satellites operated by the Japan Aerospace Exploration Agency (JAXA).
- BoM GAMSSA SST analysis: Beggs et al. (2011) and Beggs et al. (2020)
- Climatology: 1991–2020 European Space Agency (ESA) SST Climate Change Initiative (CCI) Climatology product version 3.0
Early SST data
Before the satellite era, the primary source of SST data was observations made by ships passing through the region. The frequency of these observations was too low to produce a useful weekly dataset, so it is shorter than the monthly dataset. IOD and ENSO event identification using early SST data has limited accuracy, particularly for the Indian Ocean.
SOI data
Data source: Bureau SOI data
The SOI data includes a long history of monthly pressure readings from Darwin and Tahiti that have been digitised for electronic use. Old daily pressure readings have not yet been digitised, so a shorter dataset is available.
- See also: Links open in new window
- Monthly SOI graph
During La Niña, there is typically a sustained strengthening of trade winds, while during El Niño, there is a sustained weakening, or even reversal, of trade winds across much of the tropical Pacific.
Trade winds

- Data Source: Links open in new window
- TAO/TRITON data
Outgoing longwave radiation (OLR), the amount of longwave radiation being emitted to space, can be used as an indicator of cloudiness. Equatorial cloudiness near the International Dateline typically increases during El Niño (as indicated by below average OLR) and decreases during La Niña (as indicated by above average OLR).
Cloudiness near the Date line


- Details about specific years:
- Past El Niños and La Niñas
- 2010–11 and 2011–12 La Niñas
About El Niño and La Niña (ENSO)
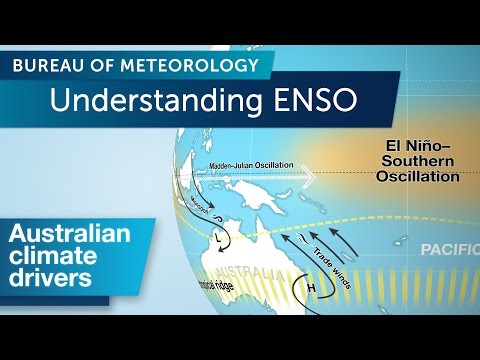
Video: Understanding ENSO

summary

summary
At a glance
ENSO is the oscillation between El Niño and La Niña conditions.
This climate influence is related to: El Niño La Niña
What is it?
The term El Niño refers to the extensive warming of the central and eastern tropical Pacific Ocean which leads to a major shift in weather patterns across the Pacific. This occurs every three to eight years and is associated with a weaker Walker Circulation (see diagram below) and drier conditions in eastern Australia. El Niño Southern Oscillation(ENSO) is the term used to describe the oscillation between the El Niño phase and the La Niña, or opposite, phase.
In the eastern Pacific, the northward flowing Humbolt current brings cooler water from the Southern Ocean to the tropics. Furthermore, along the equator, strong east to southeasterly Trade winds cause the ocean currents in the eastern Pacific to draw water from the deeper ocean towards the surface, helping to keep the surface cool. However in the far western Pacific there is no cool current, and weaker Trades mean that this "upwelling" effect is reduced. Hence waters in the western equatorial Pacific are able to warm more effectively under the influence of the tropical sun. This means that under "normal" conditions the western tropical Pacific is 8 to 10°C warmer than the eastern tropical Pacific. While the ocean surface north and northeast of Australia is typically 28 to 30°C or warmer, near South America the Pacific Ocean is close to 20°C. This warmer area of ocean is a source for convection and is associated with cloudiness and rainfall.
However, during El Niño years, the trade winds weaken and the central and eastern tropical Pacific warms up. This change in ocean temperature sees a shift in cloudiness and rainfall from the western to the central tropical Pacific Ocean.
Neutral ENSO phase
Trade winds push warm surface water to the west and help draw up deeper, cooler water in the east. The warmest waters in the equatorial Pacific build up to the north of Australia and that area become the focus for cloudiness and rainfall.

La Niña
Trade winds strengthen, increasing the temperature of the warm water north of Australia. Cloudiness and rainfall north of Australia are enhanced, typically leading to above average winter–spring rainfall for eastern and central parts of the country, and a wetter start to the northern wet season.

El Niño
Trade winds weaken (or reverse) and warmer surface water builds up in the central Pacific. Cloudiness and rainfall north of Australia are supressed, typically leading to below average winter–spring rainfall for eastern parts of the country, and a drier start to the northern wet season.

The Southern Oscillation Index, or SOI, gives an indication of the development and intensity of El Niño or La Niña in the Pacific Ocean. The SOI is calculated using the pressure differences between Tahiti and Darwin. The following figure demonstrates the typical fluctuations in SOI over a period of 11 years. Positive SOI values are shown in blue, with negative in orange. Sustained positive values are indicative of La Niña conditions, and sustained negative values indicative of El Niño conditions.
How does it affect Australia?
Each phase of the ENSO has a very different effect on the Australian climate. El Niño and La Niña generally have an autumn to autumn pattern of evolution and decay. That is, they typically begin to develop during autumn, strengthen in winter/spring, then decay during summer and autumn of the following year. These effects are described in further detail on the following pages: El Niño and La Niña.
The Indian Ocean Dipole (IOD) is defined by the difference in sea surface temperatures between the eastern and western tropical Indian Ocean. The influence of the IOD varies in conjunction with other climate indicators such as the El Niño–Southern Oscillation (ENSO).
During a negative IOD, waters are typically warmer than average in the eastern parts of the tropical Indian Ocean and cooler than average in the west. During a positive event, the reverse occurs, with cooler than average waters in the eastern parts of the tropical Indian Ocean and warmer in the west. Specific regions are monitored in the eastern and western Indian Ocean to identify IOD event development.
Weekly and monthly sea surface temperature
Indian Ocean Dipole index

About these graphs
Climate indices
An index is a measure (often a numerical value) that can be representative of a particular pattern or state of a system. Climatologists monitor several indices, some ocean-based and some atmospheric, to provide a quick indication of the state of certain climate variables and climate indicators.
El Niño–Southern Oscillation indices
El Niño and La Niña (collectively referred to as the El Niño–Southern Oscillation or ENSO) are characterised by changes in the equatorial Pacific Ocean. During El Niño, sea surface temperatures (SST) in the central and eastern Pacific Ocean become warmer than average, while during La Niña these SSTs become cooler than average.
Niño indices regions
To monitor the Pacific Ocean for signs of El Niño or La Niña, climatologists use several SST indices. These indices measure the difference between the current sea surface temperature and its long-term (1991–2020) average in several regions located along the equatorial Pacific. The difference is referred to as an anomaly. These regions are labelled Niño1, Niño2, Niño3, Niño3.4 and Niño4 and are used by meteorological agencies around the world.
The Niño regions in the Pacific Ocean, are used to monitor ENSO, with Niño3 and Niño3.4 typically used to identify El Niño and La Niña.
Niño regions cover the following areas:
- Niño1 (far eastern equatorial Pacific): 5–10°S, 80–90°W
- Niño2 (far eastern equatorial Pacific): 0–5°S, 80–90°W
- Niño3 (eastern equatorial Pacific): 5°N–5°S, 150–90°W
- Niño3.4 (central equatorial Pacific): 5°N–5°S, 120–170°W
- Niño4 (western equatorial Pacific): 5°N–5°S, 160°E–150°W
For monitoring of ENSO phases, the value of the Niño indices are often used in conjunction with other data, e.g., sub-surface ocean temperatures, cloudiness, winds, and the Southern Oscillation Index (SOI). The Bureau cites sustained monthly Niño3 or Niño3.4 values above +0.8 °C as being associated with El Niño, and values below −0.8 °C being associated with La Niña. These values are approximately one standard deviation from the long-term mean (i.e., around 70% of monthly Niño3 values in the historical record, for example, lie between −0.8 °C and +0.8 °C).
Southern Oscillation Index (SOI)
The Southern Oscillation Index, or SOI, gives an indication of the state and intensity of ENSO, from an atmospheric perspective. The SOI is calculated using the pressure differences between Tahiti and Darwin.
Sustained negative values of the SOI below −7 often indicate El Niño is active while sustained positive values above +7 are typical of a La Niña.
Early monthly pressure readings from Darwin and Tahiti have been digitised for electronic use. Early daily pressure readings have not yet been digitised, so a shorter dataset is available.
Technical details
There are a few different methods for calculating the SOI. The method used by the Australian Bureau of Meteorology is the Troup SOI which is the standardised anomaly of the Mean Sea Level Pressure difference between Tahiti and Darwin. The base period used in the SOI calculation is 60 years (1933–1992).
Calculation
                        Pdiff − Pdiffav
            SOI = 10 x -------------------,
                            SD(Pdiff)
where:
Pdiff = (average Tahiti MSLP for the period) − (average Darwin MSLP for the period),
Pdiffav = long term average of Pdiff for the period in question, and
SD(Pdiff) = long term standard deviation of Pdiff for the period in question.
The multiplication by 10 is a convention to make the final value more readable. Using this convention, the SOI ranges from about –35 to about +35, and the value of the SOI can be quoted as a whole number. The SOI is usually computed on a monthly basis, with values over longer periods such a year being sometimes used. Daily values can also be averaged over a longer period to form a multi-day average. Single-day or weekly values of the SOI are not so useful for information on the current state of the climate, as these values are dominated by the effects of short-term weather variability, and accordingly the Bureau of Meteorology does not issue them. In particular, single-day values can fluctuate markedly because of daily weather patterns, and should not be used for climate purposes.
- Details about:
- About ENSO, El Niño and La Niña
- SOI
The Indian Ocean Dipole index
Indian Ocean Dipole (IOD) phases are driven by changes in the tropical Indian Ocean. Sustained changes in the difference between normal sea surface temperatures in the tropical western and eastern Indian Ocean are what characterise IOD phases.
The IOD is commonly measured by an index (sometimes referred to as the Dipole Mode Index, or DMI) that is the difference between SST anomalies in two regions of the tropical Indian Ocean (see map):
IOD regions:
- IOD west: 50°E to 70°E and 10°S to 10°N
- IOD east: 90°E to 110°E and 10°S to 0°S
A positive IOD period is characterised by cooler than average water in the tropical eastern Indian Ocean and warmer than average water in the tropical western Indian Ocean. Conversely, a negative IOD period is characterised by warmer than average water in the tropical eastern Indian Ocean and cooler than average water in the tropical western Indian Ocean.
For monitoring the IOD, Australian climatologists consider sustained values above +0.4 °C as typical of a positive IOD, and values below −0.4 °C as typical of a negative IOD.
- Details about:
- IOD
- IOD phases
The Southern Annular Mode index
The Southern Annular Mode, or SAM, refers to the north-south movement of rain-bearing westerly winds and weather systems in the Southern Ocean, compared to the usual seasonal position. A positive SAM refers to a southward shift while a negative SAM refers to an northward shift. The typical impact on Australian rainfall from positive and negative phases of SAM depends on the time of year and interaction with other climate indicators such as El Niño or La Niña.
Sustained values of the SAM index above +1 indicate a positive SAM event, while sustained values below -1 indicate a negative SAM event.
- Details about:
- About SAM
About the data
Data periods
Daily datasets have a value for every day in their record. Similarly, weekly and monthly (30 day) data sets have values for every week or month (30 days), respectively, in their record.
Sea surface temperature data
The weekly and monthly datasets are formed from weekly or monthly averages of daily SST values, and are updated either weekly or monthly in near real-time. The daily values are obtained from interpolated (gap-free) analyses on a 0.25° latitude by 0.25° longitude grid of the temperature of the uppermost 10 metres of the ocean under well-mixed conditions, based on observations from both in-water instruments and satellites. As observations are not always available within the specified time interval for all areas covered, the daily analysis systems uses 'statistical interpolation' to fill in the gaps using a weighted combination of the previous daily SST analysis and previous weekly SST analysis.
The temperature estimate is generally considered to be at approximately 0.2 metres depth (the depth of drifting buoys). However, as the observations used for the analysis have been selected for only well-mixed conditions, these temperatures are similar to temperatures down to approximately 10 metres. The maps provide SST analysis values for each 0.25° of latitude and longitude (approximately 28 km).
The observations used to derive the global daily SST analyses are obtained from drifting buoys, moored buoys, ships, and infrared radiometers aboard Polar-Orbiting Environmental Satellites operated by the National Oceanographic and Atmospheric Administration (NOAA) and the European Space Agency (ESA). In order to fill in some of the data gaps due to satellite infrared sensors that cannot penetrate cloud, they also incorporate SST observations from microwave sensors on polar-orbiting satellites operated by the Japan Aerospace Exploration Agency (JAXA).
- BoM GAMSSA SST analysis: Beggs et al. (2011) and Beggs et al. (2020)
- Climatology: 1991–2020 European Space Agency (ESA) SST Climate Change Initiative (CCI) Climatology product version 3.0
Early SST data
Before the satellite era, the primary source of SST data was observations made by ships passing through the region. The frequency of these observations was too low to produce a useful weekly dataset, so it is shorter than the monthly dataset. IOD and ENSO event identification using early SST data has limited accuracy, particularly for the Indian Ocean.
SOI data
Data source: Bureau SOI data
The SOI data includes a long history of monthly pressure readings from Darwin and Tahiti that have been digitised for electronic use. Old daily pressure readings have not yet been digitised, so a shorter dataset is available.
- See also: Links open in new window
- SST timeseries graphs
- Sea surface temperature maps
- Map of NINO and IOD regions
About the Indian Ocean Dipole (IOD)
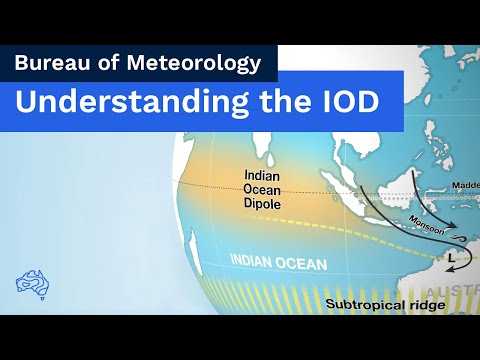
Video: Understanding IOD

Indian Ocean sea surface temperatures impact rainfall and temperature patterns over Australia. Warmer than average sea surface temperatures can provide more moisture for frontal systems and lows crossing Australia.
Indian Ocean Dipole
Sustained changes in the difference between sea surface temperatures of the tropical western and eastern Indian Ocean are known as the Indian Ocean Dipole or IOD. The IOD is one of the key drivers of Australia's climate and can have a significant impact on agriculture. This is because events generally coincide with the winter crop growing season. The IOD has three phases: neutral, positive and negative. Events usually start around May or June, peak between August and October and then rapidly decay when the monsoon arrives in the southern hemisphere around the end of spring.
Neutral IOD phase
Water from the Pacific flows between the islands of Indonesia, keeping seas to Australia's northwest warm. Air rises above this area and falls over the western half of the Indian Ocean basin, blowing westerly winds along the equator.
Temperatures are close to normal across the tropical Indian Ocean, and hence the neutral IOD results in little change to Australia's climate.

Positive IOD phase
Westerly winds weaken along the equator allowing warm water to shift towards Africa. Changes in the winds also allow cool water to rise up from the deep ocean in the east. This sets up a temperature difference across the tropical Indian Ocean with cooler than normal water in the east and warmer than normal water in the west.
Generally this means there is less moisture than normal in the atmosphere to the northwest of Australia. This changes the path of weather systems coming from Australia's west, often resulting in less rainfall and higher than normal temperatures over parts of Australia during winter and spring.

Negative IOD phase
Westerly winds intensify along the equator, allowing warmer waters to concentrate near Australia. This sets up a temperature difference across the tropical Indian Ocean, with warmer than normal water in the east and cooler than normal water in the west.
A negative IOD typically results in above-average winter–spring rainfall over parts of southern Australia as the warmer waters off northwest Australia provide more available moisture to weather systems crossing the country.

Indian Ocean Dipole years
- 1960
- 1961
- 1963
- 1967
- 1972
- 1975
- 1990
- 1992
- 1994
- 1996
- 1997
- 1998
- 2006
- 2010
- 2015
- 2016
- 2019
- 2022
there have been 9 moderate to strong negative IOD events and 9 moderate to strong positive IOD events.
- See also: Links open in new window
- Indian Ocean Dipole outlook
- Indian Ocean outlook model summary
- Graph of latest IOD Index
The Southern Annular Mode (SAM) refers to the north-south movement of rain-bearing westerly winds and weather systems in the Southern Ocean, compared to the usual seasonal position. A positive SAM refers to a southward shift while a negative SAM refers to an northward shift. The typical impact on Australian rainfall from positive and negative phases of SAM depends on the time of year and interaction with other climate indicators such as El Niño or La Niña.
Sustained values of the SAM index above +1 indicate a positive SAM event, while sustained values below -1 indicate a negative SAM event.
About these graphs
Climate indices
An index is a measure (often a numerical value) that can be representative of a particular pattern or state of a system. Climatologists monitor several indices, some ocean-based and some atmospheric, to provide a quick indication of the state of certain climate variables and climate indicators.
El Niño–Southern Oscillation indices
El Niño and La Niña (collectively referred to as the El Niño–Southern Oscillation or ENSO) are characterised by changes in the equatorial Pacific Ocean. During El Niño, sea surface temperatures (SST) in the central and eastern Pacific Ocean become warmer than average, while during La Niña these SSTs become cooler than average.
Niño indices regions
To monitor the Pacific Ocean for signs of El Niño or La Niña, climatologists use several SST indices. These indices measure the difference between the current sea surface temperature and its long-term (1991–2020) average in several regions located along the equatorial Pacific. The difference is referred to as an anomaly. These regions are labelled Niño1, Niño2, Niño3, Niño3.4 and Niño4 and are used by meteorological agencies around the world.
The Niño regions in the Pacific Ocean, are used to monitor ENSO, with Niño3 and Niño3.4 typically used to identify El Niño and La Niña.
Niño regions cover the following areas:
- Niño1 (far eastern equatorial Pacific): 5–10°S, 80–90°W
- Niño2 (far eastern equatorial Pacific): 0–5°S, 80–90°W
- Niño3 (eastern equatorial Pacific): 5°N–5°S, 150–90°W
- Niño3.4 (central equatorial Pacific): 5°N–5°S, 120–170°W
- Niño4 (western equatorial Pacific): 5°N–5°S, 160°E–150°W
For monitoring of ENSO phases, the value of the Niño indices are often used in conjunction with other data, e.g., sub-surface ocean temperatures, cloudiness, winds, and the Southern Oscillation Index (SOI). The Bureau cites sustained monthly Niño3 or Niño3.4 values above +0.8 °C as being associated with El Niño, and values below −0.8 °C being associated with La Niña. These values are approximately one standard deviation from the long-term mean (i.e., around 70% of monthly Niño3 values in the historical record, for example, lie between −0.8 °C and +0.8 °C).
Southern Oscillation Index (SOI)
The Southern Oscillation Index, or SOI, gives an indication of the state and intensity of ENSO, from an atmospheric perspective. The SOI is calculated using the pressure differences between Tahiti and Darwin.
Sustained negative values of the SOI below −7 often indicate El Niño is active while sustained positive values above +7 are typical of a La Niña.
Early monthly pressure readings from Darwin and Tahiti have been digitised for electronic use. Early daily pressure readings have not yet been digitised, so a shorter dataset is available.
Technical details
There are a few different methods for calculating the SOI. The method used by the Australian Bureau of Meteorology is the Troup SOI which is the standardised anomaly of the Mean Sea Level Pressure difference between Tahiti and Darwin. The base period used in the SOI calculation is 60 years (1933–1992).
Calculation
                        Pdiff − Pdiffav
            SOI = 10 x -------------------,
                            SD(Pdiff)
where:
Pdiff = (average Tahiti MSLP for the period) − (average Darwin MSLP for the period),
Pdiffav = long term average of Pdiff for the period in question, and
SD(Pdiff) = long term standard deviation of Pdiff for the period in question.
The multiplication by 10 is a convention to make the final value more readable. Using this convention, the SOI ranges from about –35 to about +35, and the value of the SOI can be quoted as a whole number. The SOI is usually computed on a monthly basis, with values over longer periods such a year being sometimes used. Daily values can also be averaged over a longer period to form a multi-day average. Single-day or weekly values of the SOI are not so useful for information on the current state of the climate, as these values are dominated by the effects of short-term weather variability, and accordingly the Bureau of Meteorology does not issue them. In particular, single-day values can fluctuate markedly because of daily weather patterns, and should not be used for climate purposes.
- Details about:
- About ENSO, El Niño and La Niña
- SOI
The Indian Ocean Dipole index
Indian Ocean Dipole (IOD) phases are driven by changes in the tropical Indian Ocean. Sustained changes in the difference between normal sea surface temperatures in the tropical western and eastern Indian Ocean are what characterise IOD phases.
The IOD is commonly measured by an index (sometimes referred to as the Dipole Mode Index, or DMI) that is the difference between SST anomalies in two regions of the tropical Indian Ocean (see map):
IOD regions:
- IOD west: 50°E to 70°E and 10°S to 10°N
- IOD east: 90°E to 110°E and 10°S to 0°S
A positive IOD period is characterised by cooler than average water in the tropical eastern Indian Ocean and warmer than average water in the tropical western Indian Ocean. Conversely, a negative IOD period is characterised by warmer than average water in the tropical eastern Indian Ocean and cooler than average water in the tropical western Indian Ocean.
For monitoring the IOD, Australian climatologists consider sustained values above +0.4 °C as typical of a positive IOD, and values below −0.4 °C as typical of a negative IOD.
- Details about:
- IOD
- IOD phases
The Southern Annular Mode index
The Southern Annular Mode, or SAM, refers to the north-south movement of rain-bearing westerly winds and weather systems in the Southern Ocean, compared to the usual seasonal position. A positive SAM refers to a southward shift while a negative SAM refers to an northward shift. The typical impact on Australian rainfall from positive and negative phases of SAM depends on the time of year and interaction with other climate indicators such as El Niño or La Niña.
Sustained values of the SAM index above +1 indicate a positive SAM event, while sustained values below -1 indicate a negative SAM event.
- Details about:
- About SAM
About the data
Data periods
Daily datasets have a value for every day in their record. Similarly, weekly and monthly (30 day) data sets have values for every week or month (30 days), respectively, in their record.
Sea surface temperature data
The weekly and monthly datasets are formed from weekly or monthly averages of daily SST values, and are updated either weekly or monthly in near real-time. The daily values are obtained from interpolated (gap-free) analyses on a 0.25° latitude by 0.25° longitude grid of the temperature of the uppermost 10 metres of the ocean under well-mixed conditions, based on observations from both in-water instruments and satellites. As observations are not always available within the specified time interval for all areas covered, the daily analysis systems uses 'statistical interpolation' to fill in the gaps using a weighted combination of the previous daily SST analysis and previous weekly SST analysis.
The temperature estimate is generally considered to be at approximately 0.2 metres depth (the depth of drifting buoys). However, as the observations used for the analysis have been selected for only well-mixed conditions, these temperatures are similar to temperatures down to approximately 10 metres. The maps provide SST analysis values for each 0.25° of latitude and longitude (approximately 28 km).
The observations used to derive the global daily SST analyses are obtained from drifting buoys, moored buoys, ships, and infrared radiometers aboard Polar-Orbiting Environmental Satellites operated by the National Oceanographic and Atmospheric Administration (NOAA) and the European Space Agency (ESA). In order to fill in some of the data gaps due to satellite infrared sensors that cannot penetrate cloud, they also incorporate SST observations from microwave sensors on polar-orbiting satellites operated by the Japan Aerospace Exploration Agency (JAXA).
- BoM GAMSSA SST analysis: Beggs et al. (2011) and Beggs et al. (2020)
- Climatology: 1991–2020 European Space Agency (ESA) SST Climate Change Initiative (CCI) Climatology product version 3.0
Early SST data
Before the satellite era, the primary source of SST data was observations made by ships passing through the region. The frequency of these observations was too low to produce a useful weekly dataset, so it is shorter than the monthly dataset. IOD and ENSO event identification using early SST data has limited accuracy, particularly for the Indian Ocean.
SOI data
Data source: Bureau SOI data
The SOI data includes a long history of monthly pressure readings from Darwin and Tahiti that have been digitised for electronic use. Old daily pressure readings have not yet been digitised, so a shorter dataset is available.
About the Southern Annular Mode (SAM)
At a glance
The Southern Annular Mode can result in enhanced rainfall in regions of southern Australia.
This climate influence is related to: ENSO Frontal Systems


What is it?
The Southern Annular Mode, or SAM, also known as the Antarctic Oscillation (AAO), is a mode of variability which can affect rainfall in southern Australia. The SAM refers to the north/south movement of the strong westerly winds that dominate the middle to higher latitudes of the Southern Hemisphere. The belt of strong westerly winds in the Southern Hemisphere is also associated with the storm systems and cold fronts that move from west to east.
During the summer and autumn months (December through to May) the SAM is showing an increasing tendency to remain in a positive phase, with westerly winds contracted towards the south pole.
The contribution that the SAM makes to the climate variability in Australia and the apparent positive trend in the SAM are relatively recent discoveries and as such are still active areas of research.
SAM summer negative phase
In a negative SAM phase, the belt of westerly winds expands towards the equator and Australia. Shifting the westerly winds to the north in summer means less moist onshore flow from the east, and thus typically decreases rainfall over eastern Australia. For Tasmania, the northward displacement of the westerlies means a stronger than normal westerly flow over the island, enhancing rainfall in the west.

SAM summer positive phase
In a positive SAM phase, the belt of westerly winds contracts towards Antarctica. Since the westerly winds and high pressure are already further south below the continent, the southward movement only acts to decrease rain events for western Tasmania. In eastern Australia, the southward movement of the westerly winds means that more moist onshore flow from the Tasman and Coral seas is drawn inland, and thus increases rainfall for eastern Australia. This effect for eastern parts of Australia is much more widespread in summer as the east coast climatologically receives its highest rainfall in the summertime.

SAM winter negative phase
In a negative SAM phase, the belt of westerly winds expands and is positioned more northwards towards the equator and Australia. This results in stronger than normal westerly winds, lower atmospheric pressure, more cold fronts and more storm systems over southern Australia. Typically this means that there are morerain events in winter for southern Australia. However, in eastern Australia, the northward displacement of the westerly winds means less moist onshore flow from the east, and thus decreases rainfall for eastern Australia.

SAM winter positive phase
In a positive SAM phase, the belt of westerly winds contracts towards Antarctica. This results in weaker than normal westerly winds and higher pressures over southern Australia, restricting the passage of cold fronts inland. Generally, this means that there are fewer rain events in winter for southern Australia. However, in eastern Australia, the southward movement of the westerly winds means more easterly onshore flow is experienced. This wind is moist as it has just flowed from the Tasman and Coral seas and therefore typically brings more rainfall to the east.

Where, when and for how long does it occur?

The diagram above shows the area affected by the Southern Annular Mode, when it occurs and how long it may last.
In terms of mean sea level pressure, the SAM affects the coastal regions of southern Australia throughout the year. Extreme negative phases of the SAM can cause increased rainfall and cold air outbreaks in southern Australia.
Each SAM event, both positive and negative, tends to last for around ten days to two weeks. The time frame between positive and negative events however is quite random, but is typically in the range of a week to a few months.
How does it affect Australia?
The impact that the SAM has on rainfall varies greatly depending on season and region. If Australia were a few degrees further south, then the impact of changes in SAM would be much more pronounced. The diagram below describes the average impact on rainfall during a "positive" (westerly winds further south) SAM event.
The SAM also has an impact on temperatures. In general, in areas where rainfall is increased, temperature is decreased whilst where rainfall is decreased, temperature is increased.

The diagram above shows the impact that a "positive" SAM event (decreased westerly winds) has on Australian rainfall. Shading indicates daily rainfall anomaly in mm/day for each of the seasons. (Source: Hendon et al. 2007)
History
![]() Unless otherwise noted, all maps, graphs and diagrams in this page are licensed under the Creative Commons Attribution 4.0 International Licence
Unless otherwise noted, all maps, graphs and diagrams in this page are licensed under the Creative Commons Attribution 4.0 International Licence
