


How to use the AR&R87 IFD tool
What is IFD data?
The abbreviation IFD stands for Intensity-Frequency-Duration; it refers to statistics on rainfall.
In order to explain what it is, we must first define some terms about rainfall. We usually think of rainfall as being of a certain DEPTH (measured in mm). But for completeness, we also need to specify the length of time over which the rainfall occurred: one year - in the case of annual rainfall; one month (for many climate purposes); or so many days, hours or minutes. This period of time over which the rain is measured is called the DURATION.
So rain is well described in terms of a depth of rainfall over a certain duration. To compare the severity of different rainfall events, we might compare several rainfalls measured over one hour. For instance, we might be interested in the highest one-hour rainfall during a calendar year at a certain location. And going one step further, a civil engineer designing a drain intended to fail (no more frequently than) once every ten years (on average) might ask the question, "What is the rainfall depth over one hour exceeded, on average, once in ten years?". This "once in ten years" is a FREQUENCY.
Before going further, we will explain that for AR&R 87 IFDs, the Bureau of Meteorology does not use depth of rainfall in this particular context but prefers to use rainfall rate (in mm per hour), known as INTENSITY. It is calculated by dividing the depth by the duration and is simply a measure of the 'heaviness' of the rainfall.
We now have our three terms: "Intensity", "Frequency" and "Duration" used in the abbreviation "IFD".
Just as the engineer might ask about the 1-hour rainfall exceeded on average once in 10 years, so another might ask about the 72-hour rainfall exceeded on average once every 100 years. In fact the number of possible combinations of duration and frequency is many - take any one of 13 standard durations from 5 minutes to 72 hours, and any one of 7 frequencies from 1 per year to 1 per 100 years, and you have 91 combinations. For this reason, the results are best tabulated, or represented as a graph of intensity versus duration for 7 different frequencies (see below). [For convenience, frequencies (e.g. 1 per 100 years) are replaced by "Average Recurrence Intervals" or "Return Periods" (e.g. 100 years).]
For a more in-depth discussion of ARI see the following: WHY DO 100 YEAR EVENTS HAPPEN SO OFTEN?.
As implied above, the main use of these data is in engineering design.
IFDs are commonly used in:
- design and risk assessment of dams and bridges,
- design of roof and stormwater drainage systems,
- flood plain management,
- soil conservation studies,
- to express the "severity" of a single rainfall event (in terms of its rarity).
The process of estimating IFDs, known as frequency analysis, is an important part of hydrological design procedures. An analysis of rainfall data from a single station is often unreliable; not temporally or spatially consistent; and should generally not be used for design purposes. Instead a set of accurate, consistent IFD data have been derived for the whole of Australia. This work was carried out by the Bureau of Meteorology as part of the revision of Australian Rainfall and Runoff (Institute of Engineers Australia, 1987).
The variables used to calculate IFDs are stored on a 0.025o latitude by 0.025o longitude grid (approx 2.5km by 2.5km) covering Australia. These variables are displayed on the results pages under the heading "Raw data". When a set of coordinates is entered this system returns the IFD results for the nearest grid-point.
Running the Program - Inputs
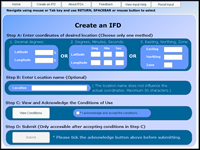
There are two versions of the system: for computers with and without Flash. The Flash version requires the Adobe Flashplayer.
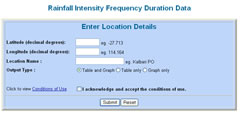
Inputs are used to enter the coordinates required for producing the IFD chart and the place name for this location.
There are three possible ways of expressing the coordinate data.
- Latitude and Longitude in decimal degrees.
(N.B. negative and positive values are accepted for latitude and are assumed to be degrees south)
e.g. -37.500o, 141.259o. - Latitude and Longitude as degrees, minutes and seconds. (Not available in the non-Flash version)
e.g. 37o 30' 10", 141o 54' 32" - Easting and Northing. (Not available in the non-Flash version.)
The Australian Map Grid zone must be included.
e.g. 536,000.50, 6,548,000.25, zone=55.
IFD information is held at a resolution of about 2.5 km. It is therefore important to use accurate location data and not just the name, or central location, of a large city such as Melbourne or Sydney (which would contain many grid points). Professionals such as engineers and architects may be expected to have a topographic map or a GPS (Global Positioning System) receiver.
An alternative is to use the Geoscience Australia website for a general place-name search or use the Map Connect utility to find more specific coordinates. Please also note GeoScience Australia's policies and caveats on use of these systems for determining accurate coordinates. You may also like to download GoogleEarth which enables you to zoom down to street level in most larger cities and take note of the coordinates. Remember that for any serious use of this application it is recommended to seek professional advice concerning the exact location coordinates.
Only one set of coordinates is permitted at a time, so you cannot, for example, put decimal degrees coordinates and easting northing coordinates at the same time.
A place name may be entered in the location field, and this name will appear on the results page. Note however, the location name does not influence the coordinate choice in any way.
The RESET button is used to clear all input fields.
The SUBMIT button prepares the IFD chart and tables from this set of coordinates for viewing and subsequent printing if required.
Caveats on Coordinates
Data are derived automatically by computer using the values at the nearest grid-point to the input location on the 0.025o grid. In general therefore the location of the data produced will not match exactly that of the input location. To guard against the possibility of accidentally entering data incorrectly, it is essential that users check that the latitude and longitude on the chart and table produced correspond (to the nearest 0.025o) to the location required.
Program Outputs
- IFD Chart
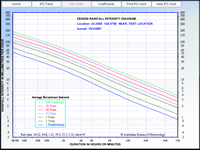
The rainfall intensity for each standard ARI is plotted on a graph of intensity versus duration. The range of duration on the x-axis is from 5 minutes to 72 hours. The seven curves: for 1, 2, 5, 10, 20, 50 and 100 year ARIs have a negative gradient, consistent with experience that "heavier" rainfall occurs over shorter durations.
To determine the ARI (rarity) of an event: Plot a point on the chart corresponding to the observed intensity and duration
Read which ARI curves the point falls between (say X and Y years)
Then it may be said that the event has an ARI between X and Y years at the specified duration.
- IFD Table
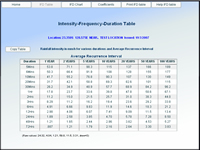
The tables are a tabulated version of the curves on the chart, they contain intensity values in mm/h at standard durations from 5 minutes to 72 hours and ARIs from 1 to 100 years. The intensity values are displayed to 3 significant figures. - Polynomial Coefficients and Constants Table
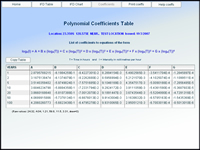
This table is unimportant for the average user; it just provides supplementary information about the curves on the IFD chart. The seven ARI curves on the IFD chart are sixth order polynomials. The Table contains the polynomial coefficients and constant for each ARI. Substituting these values and the duration (in hours) into the given equation provides an intensity for that duration (within the 5 min to 72 hour range. This may be used to calculate intensities accurately between standard durations (but at standard ARIs).
Example
Bathurst Airport, latitude -33.400o, longitude 149.650o, 6 minute duration and 100 year ARI.
- The constant and six coefficients are:
3.948788, -0.66752E+0, -0.41531E-1, 0.86465E-2, 0.11640E-2, -0.24334E-3 and -0.33721E-4.
The coefficients are in standard form where "E" indicates 10 to the power of the following exponent, as on many electronic calculators. - The equation is:
ln(I) = A + B(ln(T)) + C(ln(T))2 + D(ln(T))3 + E(ln(T))4 + F(ln(T))5 + G(ln(T))6 - Substitute the seven coefficients into the equation.
ln(I) = 3.948788-0.66752(ln(T))-0.041531(ln(T))2+0.0086465(ln(T))3+0.001164(ln(T))4-0.00024334(ln(T))5-0.000033721(ln(T))6 - Substitute ln(0.1) hours for ln(T). Thus ln(T) = -2.302585093
ln(I) = 3.948788-0.66752(-2.302585093)-0.041531(-2.302585093)2+0.0086465(-2.302585093)3+0.001164(-2.302585093)4-0.00024334(-2.302585093)5-0.000033721(-2.302585093)6
- Evaluate the exponentials and express all numbers to about 8 significant figures.
ln(I) = 3.948788 - 0.66752(-2.302585093) - 0.041531(5.301898110) + 0.0086465(-12.208071554) + 0.001164(28.110123574) - 0.00024334(-64.725951503) - 0.000033721(149.037011062) - Solve for ln(I).
ln(I) = 3.948788000 + 1.537021601 - 0.220193130 - 0.105557091 + 0.032720184 + 0.015750413 - 0.005025677
ln(I) = 5.203504300
- Take the exponential of both sides.
exp(ln(I)) = exp(5.203504300)
I = 181.908588514 - Take I to three significant figures
I = 182 mm/hr.
- The constant and six coefficients are:
- Calculate an ARI
To determine the rarity of a rainfall event for the chosen co-ordinates, enter the Rainfall Total in millimetres and the duration, in minutes, over which the rain fell. The Average Recurrence Interval(ARI) and Average Exceedance Probability(AEP) will be given.
For a more in-depth discussion of ARI see the following: WHY DO 100 YEAR EVENTS HAPPEN SO OFTEN?.
ExampleLocation : 33.400S 149.650E Rainfall total : 40 mm Duration : 30 minutes Rainfall intensity : 80 mm/h Average Recurrence Interval(ARI) of between 50 years and 100 years. Average Exceedance Probability(AEP) estimate of between 1% and 2%.
Conversion of units
- To convert a duration in minutes into hours, divide by 60:
ie: 30 minutes => 30 / 60 = 0.5 hour.
720 minutes => 720 / 60 = 12 hours.
- To convert a rainfall depth during a period of time into an intensity in mm/hr. The depth in mm is divided by the duration in hours :
ie: 50 mm over 30 minutes. => 50 / 0.5 = 100 mm/hr.
100 mm over 720 minutes => 100 / 12.0 = 8.3 mm/hr.
References
Institution of Engineers, Australia (1987). Australian Rainfall and Runoff - A Guide to Flood Estimation, Revised Edition
Frequently Asked Questions
Additional information may be found in the Frequently Asked Questions.